Welcome to the Smart Vision knowledge base
Whether you’re just getting started with SPSS or looking to sharpen your data science skills, you’ll find everything you need here in one place. Our Knowledge Base brings together hundreds of articles, how-to guides, blogs, downloadable resources, recorded webinars, and FAQs – all focused on SPSS Statistics, SPSS Modeler, predictive analytics and related tools.
Finding what you need is simple. Use the topic filter on the left to browse by content type – Blogs, Downloads, Events, Videos, or FAQs – or type a keyword into the search bar to go straight to the subject you’re looking for. Whether you want to understand a statistical concept, solve a practical SPSS problem, or explore new techniques like machine learning or text analytics, the Knowledge Base has you covered.
-
-
-
Live & Upcoming Events
-
3 September 2026, 10:00 am
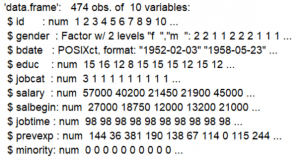
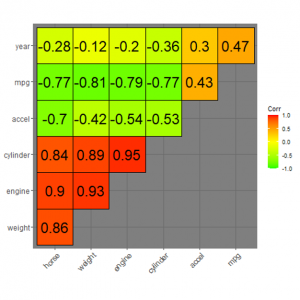
Explore correlation analysis in SPSS Statistics. Learn how correlation coefficients can reveal powerful linear relationships between variables, from price and demand to education and salaries.
-
3 September 2026, 12:00 pm
The webinar will give you a straightforward overview of how simple regression techniques can help your business and how to get started with regression analysis in SPSS.
-
3 September 2026, 3:00 pm
Learn how to go beyond establishing whether relationships exist to understanding why and for whom they occur, using moderation and mediation analysis in SPSS. Explore how interaction effects and underlying mechanisms can reveal deeper insights in your data.
-
8 September 2026, 10:00 am
Turn unstructured text into structured insight with Smart Vision Europe’s new Text Categoriser, powered by IBM watsonx.ai. This webinar demonstrates how to classify survey verbatims, reviews and support tickets directly within SPSS Statistics – generating new variables for segmentation, reporting and further statistical analysis.
-
7 October 2026, 10:00 am
If you’ve been thinking about how your organisation could benefit from predictive analytics then this session will show you how easy it is to get started with IBM SPSS Statistics. During the session we will walk you through the three key areas that will enable you to make truly effective use of this powerful analytical…
-
7 October 2026, 12:00 pm
What do so called ‘significance tests’ signify? In this webinar we unpack the reasoning and theory associated with p values, null hypotheses and the whole idea of using statistics to carry out ‘tests’.
-
7 October 2026, 3:00 pm
Discover just how simple it can be to build your own ChatGPT-like capability using Retrieval Augmented Generation (RAG) with IBM
-
2 November 2026, 3:00 pm
This webinar focuses on the value of data science and advanced analytics. The session gets behind the hype to explain what data science really is, how it could make a difference to your organisation.
-
1 December 2026, 10:00 am
In this webinar we show how analysts and researchers can tackle key healthcare challenges in SPSS Statistics, from patient satisfaction surveys to clinical outcomes research, covering essential techniques including correlations, multivariate visualisation, risk estimation and survival analysis.
-
1 December 2026, 12:00 pm
This webinar explores how Linear Regression and Logistic Regression can be applied to real-world healthcare challenges using IBM SPSS Statistics — from modelling cancer incidence in populations to predicting low birthweight, while covering key techniques for identifying and troubleshooting problems in your regression models.
-
1 December 2026, 3:00 pm
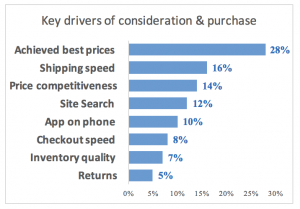
In this webinar we will show you how you can leverage SPSS to make smarter, data-driven marketing decisions. In particular, we’ll cover four powerful techniques that can transform how you understand and engage with your customers.
On-Demand Webinars
-
An introduction to Neural Networks in SPSS Statistics. Learn how these models work, how to build and train a simple network and how to improve accuracy by tuning key parameters, how to save your model and apply it to new data for scoring.
-
Using real charity case studies, we show how data-driven techniques improve response rates, reduce mailing costs and guide smarter targeting.
-
This webinar shows how predictive analytics can help universities identify students at risk of dropping out and take action before disengagement turns into withdrawal.
-
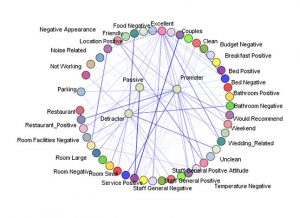
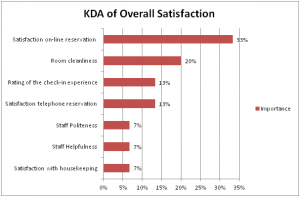
This webinar shows how to use SPSS Statistics to analyse Tenant Satisfaction data. Learn how to prepare and filter survey data, test relationships between variables, calculate confidence intervals and create clear visualisations.
-
Learn how to use SPSS to import and format data, create filters and derived fields, build clear tables and identify statistically significant differences. A practical, accessible overview designed for non-statisticians who want to understand what SPSS Statistics can offer.
-
This webinar explains the licensing and implementation options for IBM SPSS Statistics in NHS settings. Learn how the SPSS modules fit together, how to assess which you need and what factors to consider when choosing the right licence.
-
This webinar outlines the key licensing and implementation options for IBM SPSS Statistics. You will learn how the modules fit together, which factors influence the right licence choice and how to match your organisation’s needs with the most suitable deployment model.
-
This webinar shows how statistical analysis can uncover issues in equal opportunities. We will also look at how techniques such as decision trees can be used to uncover the key factors that drive employee defection.
-
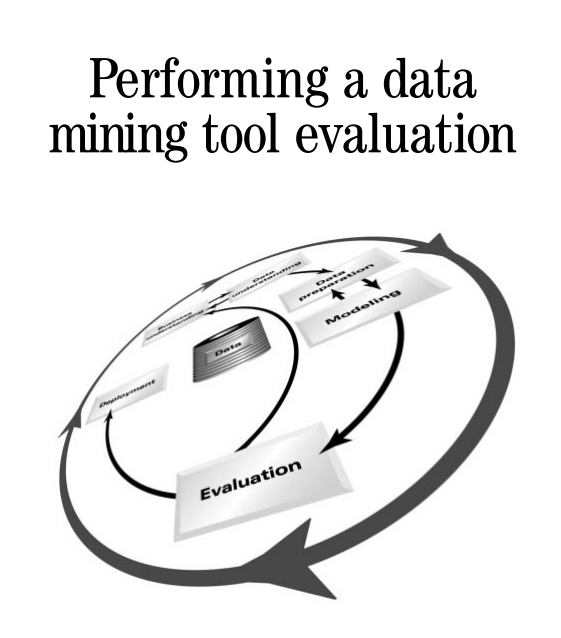
This webinar introduces CRISP-DM, the leading methodology for managing predictive analytics and data mining projects. Learn the six stages, understand key team roles and see how the framework prevents common pitfalls.
-
This webinar shows how predictive analytics can help you spot early signs of customer churn and intervene before valuable customers leave. Learn how churn models identify key risk drivers, generate individual risk scores and guide the most effective retention actions.
-
This webinar shows how predictive maintenance and advanced analytics can improve asset management across sectors. Learn how asset data is prepared and modelled, how static and dynamic sources combine to produce accurate risk estimates and how text mining enriches predictions.
-
This on-demand session offers a clear introduction to predictive analytics and how it can help you unlock more value from your data. Learn what predictive analytics is, how other organisations are already using it and the steps needed to get started.
-
This webinar examines why predictive analytics projects often fail and what drives successful outcomes. Using the CRISP-DM framework, it explores how to set meaningful objectives, test model performance, manage resources and avoid common pitfalls.
-
This webinar introduces Bayesian statistical analysis and shows how to run Bayesian tests in SPSS. Learn about priors, credible intervals, Bayes Factors and how Bayesian thinking differs from the classical Frequentist approach.
-
This session provides a practical overview of tools and techniques for improving operational efficiency and decision making.
-
This webinar tackles the critical challenge of ML/AI deployment — exploring the key blockers, the latest cloud and standalone deployment options, and how to ensure your data science investment delivers real business value.
-
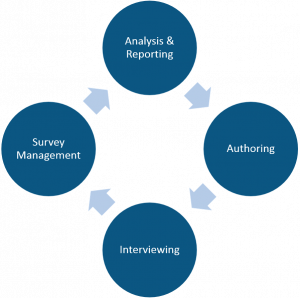
This webinar introduces UNICOM Intelligence Reporter and shows how it speeds up the creation of flexible, interactive tables for survey research.
-
This webinar introduces time series forecasting in IBM SPSS Statistics. Learn how to visualise data, apply smoothing, define periodicity, build ARIMA models, interpret results and generate accurate forecasts.
-
This on-demand session demonstrates six proven techniques to improve predictive model accuracy, including bagging, boosting, feature engineering, ensemble methods, meta-modelling and split-method models.
-
Learn how to identify sentiment, categorise free text and combine unstructured information with traditional analytics to generate richer insight. A practical guide for organisations looking to make better use of their text data.
-
The webinar will give you a straightforward overview of how simple regression techniques can help your business and how to get started with regression analysis in SPSS.
-
This session will give you a straightforward overview of how decision trees work and how they can be applied to solve a range of business problems.
-
Learn how to visualise time-based data, define periodicity, apply smoothing methods, assess model fit and incorporate predictor fields to improve accuracy.
-
Learn how to reduce large sets of variables into meaningful factors, interpret PCA outputs and build practical clusters for segmentation.
-
This webinar explains how to evaluate predictive models and deploy them effectively. Learn how to compare accuracy measures, use gains and ROC charts, assess profitability and test performance before deployment.
-
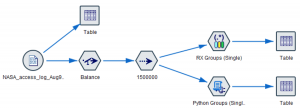
This webinar shows how SPSS Modeler’s REGEX nodes make advanced text handling easier. Ideal for Modeler users looking to extend their text-processing skills.
-
This webinar introduces data-driven segmentation using cluster analysis. Learn how to explore your data in SPSS, identify meaningful groups, interpret clustering results and build segmentation models you can apply to new data.
-
This webinar shows how predictive analytics can improve both outbound and inbound marketing performance. A practical introduction for marketers looking to move beyond simple rules-based approaches.
-
In this webinar we’ll show you how to clean and prepare data for analysis using standard functionality in SPSS Statistics.
-
See how to create customised routines in SPSS Statistics without coding. Learn to build hot buttons, use the Custom Dialog Builder, create flexible table-format dialogs and combine multiple routines into streamlined procedures.
-
Discover just how simple it can be to build your own ChatGPT-like capability using Retrieval Augmented Generation (RAG) with IBM
-
Explore correlation analysis in SPSS Statistics. Learn how correlation coefficients can reveal powerful linear relationships between variables, from price and demand to education and salaries.
-
Learn the CRISP-DM process, explore different modelling techniques, define targets and inputs, build decision tree models, compare techniques with Auto-Classifier and assess performance. The session also covers deploying models to generate predictions on live data.
-
This webinar shows how to automate SPSS workflows using syntax, macros, scheduled tasks, VBA and Python. Learn how to streamline repetitive jobs, integrate SPSS with Excel and PowerPoint, create custom dialogs and build your own analyses.
-
This on-demand session introduces DataRobot’s AI Cloud platform and shows how to build and evaluate predictive models automatically. A clear introduction to automated machine learning.
-
This webinar shows how DataRobot’s Automated Time Series delivers advanced, AI-driven forecasting with minimal set-up. Learn how to generate multi-series forecasts, use automated clustering, handle missing data and assess accuracy with time-aware back tests.
-
This on-demand session shows how to uncover richer insight from survey data. Learn to identify meaningful patterns, work with rating scales, analyse multiple response questions, interpret text comments and create new variables.
-
If you’ve been thinking about how your organisation could benefit from predictive analytics then this session will show you how easy it is to get started with IBM SPSS Statistics. During the session we will walk you through the three key areas that will enable you to make truly effective use of this powerful analytical…
-
What do so called ‘significance tests’ signify? In this webinar we unpack the reasoning and theory associated with p values, null hypotheses and the whole idea of using statistics to carry out ‘tests’.
-
This webinar focuses on the value of data science and advanced analytics. The session gets behind the hype to explain what data science really is, how it could make a difference to your organisation.
-
This webinar explores how Linear Regression and Logistic Regression can be applied to real-world healthcare challenges using IBM SPSS Statistics — from modelling cancer incidence in populations to predicting low birthweight, while covering key techniques for identifying and troubleshooting problems in your regression models.
-
In this webinar we will show you how you can leverage SPSS to make smarter, data-driven marketing decisions. In particular, we’ll cover four powerful techniques that can transform how you understand and engage with your customers.
-
In this webinar we show how analysts and researchers can tackle key healthcare challenges in SPSS Statistics, from patient satisfaction surveys to clinical outcomes research, covering essential techniques including correlations, multivariate visualisation, risk estimation and survival analysis.
-
-
-
![A look inside Data Robot]()
There is nothing artificial about the problems of the real world. So, should we settle for just artificial intelligence? Find out how DataRobot is bringing the impact of AI out of the box, helping the heroes of the intelligence revolution by augmenting the way they analyse data and deliver real value.
-
![IBM SPSS Statistics Digital subscriptions]()
How SPSS subscriptions work, the options available and when a subscription might be right for you.
-
![IBM SPSS Statistics Regression module]()
A two minute module overview of the IBM SPSS Statistics Regression module
-
![IBM SPSS Statistics Neural Networks module]()
A two minute module overview of the IBM SPSS Statistics Neural Networks module.
-
![IBM SPSS Statistics Missing Values module]()
A two minute module overview of the IBM SPSS Statistics Missing Values module.
-
![IBM SPSS Statistics Forecasting module]()
A two minute overview of the IBM SPSS Statistics Forecasting module.
-
![IBM SPSS Statistics Exact Tests module]()
A two minute overview of the IBM SPSS Statistics Exact Tests module
-
![IBM SPSS Statistics Direct Marketing module]()
A two minute overview of the IBM SPSS Statistics Direct Marketing module.
-
![IBM SPSS Statistics Decision Trees module]()
A two minute overview of the IBM SPSS Statistics Decision Trees module.
-
![IBM SPSS Statistics Data Preparation module]()
A two minute overview of the IBM SPSS Statistics Data Preparation module.
-
![IBM SPSS Statistics Custom Tables module]()
A two minute overview of the IBM SPSS Statistics Custom Tables module.
-
![IBM SPSS Statistics Conjoint module]()
A two minute module overview of the IBM SPSS Statistics Conjoint module.
-
![IBM SPSS Complex Samples module]()
A two minute module overview of the IBM SPSS Statistics Complex Samples module.
-
![IBM SPSS Categories module]()
A two minute module overview of the IBM SPSS Statistics Categories module.
-
![IBM SPSS Bootstrapping module]()
A two minute module overview of the IBM SPSS Statistics Bootstrapping module.
-
![IBM SPSS Advanced Statistics module]()
A two minute module overview of the IBM SPSS Advanced Statistics module
-
![Introduction to predictive operational analytics]()
In this series we show how Predictive Operational Analytics combines market-leading predictive analytics software, ready-to-use application templates and a fully supported professional services package to enable rapid and effective implementation and deployment.
-
![Introduction to Predictive Promoter]()
This video series shows how data science can be applied to net promoter scoring to help you gain a much deeper understanding of the factors driving your customer recommendation ratings and how you can take action to influence them influence them.
-
![Text mining in SPSS Modeler]()
This series of videos shows you how you can analyse customer comments or indeed any free-text data, using the power of the text analytics engine contained in SPSS Modeler Premium.
-
![Six secrets of building better models]()
In this series of videos we look at some often overlooked approaches which may lead to better predictive accuracy. We focus on improving the accuracy of a predictive model applied to a classification prediction problem.
-
![Working with the SPSS Custom Tables module]()
In this series of videos, Jarlath Quinn explores the rich tabulation functionality In the SPSS Custom Tables module.
-
![Introduction to survival analysis]()
Survival analysis is a powerful analytical approach that is often employed in medical applications where researchers are interested in modelling the effects of different treatments or conditions upon patient survival time.
-
![Getting started with SPSS syntax]()
SPSS Syntax has long been exploited by expert analysts due to its flexibility, power and ease of learning, plus ability to increase users’ productivity. This series of videos covers the basics to help you get started with SPSS syntax.
-
![Introduction to structural equation modelling with SPSS Amos]()
These videos introduces the concept of Structural Equation Modelling with SPSS AMOS. In the first video we uses the example of creating a simple linear model to illustrate the functionality in the AMOS interface. In the second video, we show how to perform a basic Confirmatory Factor Analysis in AMOS.
-
![Bayesian analysis in SPSS Statistics]()
In this series of videos we explore Bayesian approaches to statistical analysis and show how to perform and interpret a Bayesian independent samples test in SPSS Statistics.
-
![Creating charts in SPSS Statistics]()
This series of videos shows you how to work effectively with charts in SPSS Statistics, demonstrating some of the most popular charting procedures.
-
![Introduction to the Neural Network module in SPSS]()
In this two-part video series Jarlath Quinn explores how to work with the Neural Networks module in SPSS Statistics.
-
![Exporting data from Survey Monkey to SPSS]()
In this series of videos Jarlath Quinn looks at the various options available to SurveyMonkey and SPSS users as well as the pros and cons of one method over another.
-
![Introduction to discriminant analysis]()
In these two videos we show how Discriminant Function Analysis can be used to predict the classes of a three category outcome.
-
![Introduction to poisson regression]()
In this 3-part video series, Jarlath Quinn introduces the fundamentals of Poisson Regression and shows how to run the procedure and interpret the output in IBM SPSS Statistics.
-
![Identifying unusual cases: anomaly detection with SPSS]()
In this video, we show how to spot anomalous records using the Identify Unusual Cases procedure in SPSS Statistics.
-
![How can I weight data in SPSS Statistics?]()
In this video, we show you how to weight data in SPSS so that samples better reflect the population from which they were drawn. In particular, we show how to create a weight variable and apply it using the Weight Cases procedure before demonstrating how to weight data based on multiple variables using the Rake…
-
![Making sense of odds ratios and relative risk estimates in SPSS Statistics]()
In this video, Jarlath Quinn explains how odds and relative risks are calculated and how you can code and arrange your variables so that interpretation is as straightforward as possible.
-
![Introduction to linear regression]()
In classical statistics, linear regression is regarded as the ‘gateway to predictive modelling’. For decades students have been taught about regression from theory to practice simply because it still one of the most versatile and simple ways to understand and predict the effect of key factors on critical outcomes.
-
![Modelling non-linear relationships with SPSS]()
In this video Jarlath Quinn shows how you can move beyond simple linear regression to model curvilinear relationships using techniques such as variable transformations and quadratic regression before finally exploring how log-log regression can be used to model price elasticity of demand.
-
![An introduction to moderation analysis]()
The video explores moderation analysis, which enables analysts to identify interaction effects that alter the relationship between a dependent and independent variable.
-
![An introduction to mediation analysis]()
This video explores mediation analysis – an analytical approach used to test if a third factor could represent the underlying cause of a relationship between an independent and dependent variable.
-
![How to change the appearance of your output in SPSS Statistics]()
We’re often asked how you can change the appearance of the tables that SPSS generates as output. In this video Jarlath Quinn demonstrates two different ways to do this, either by choosing a different table look in the edit / options function, or by editing the table properties directly yourself.
-
![How to merge files in SPSS Statistics]()
In this video Jarlath Quinn demonstrates how to merge data files within SPSS Statistics using each of the two main methods, either adding cases (combining files with the same fields but additional rows) or adding variables (combining files by joining variables to a target file using something like an ID field as a ‘keyed variable’).
-
![How to create grouped or banded variables in SPSS Statistics]()
SPSS users often want to be able to create grouped or banded data from continuous fields such as, for example, creating age groups or income bands from continuous fields. In this video Jarlath Quinn demonstrates how to use the visual binning procedure within SPSS Statistics to do this.
-
![How to recode your data in SPSS Statistics]()
Recoding your data means changing the values of a variable so that they represent something else. Within SPSS Statistics there is more than one type of recode that can be performed.
-
![How to check your data for normality in SPSS Statistics]()
In this video Jarlath Quinn demonstrates how to use the functions within the explore command in SPSS Statistics to test for normality.
-
![How to calculate with dates in SPSS Statistics]()
In this video Jarlath Quinn demonstrates how to work with date and time variables in SPSS using the SPSS date and time wizard.
-
![How to select cases in SPSS Statistics]()
In this video Jarlath Quinn demonstrates how to use SPSS Statistics to define data filters in order to select particular cases for analysis. This can be done either to create a temporary selection or to create a permanent new file with only a subsection of cases included within it.
-
![How to reverse a scale in SPSS Statistics]()
In this video Jarlath Quinn demonstrates how to reverse the values of a rating scale (such as an agreement scale or a satisfaction scale) in SPSS Statistics, so that the highest value becomes the lowest value and vice versa.
-
![How to combine variables in SPSS Statistics]()
SPSS users often want to know how they can combine variables together. In this video Jarlath Quinn demonstrates how to use the compute procedure to calculate the mean of a number of variables to create one combined variable, and also how to use the count values procedure to count how many times a particular value…
-
![TURF analysis with SPSS Statistics]()
In this video Jarlath Quinn introduces the popular TURF analysis technique and demonstrates how to apply it in IBM SPSS Statistics. TURF analysis is used in many industries to find the optimal sub-group of options from a wider portfolio in order to maximise their appeal to an audience or market.
-
![Cluster Analysis with IBM SPSS Statistics]()
In this video Jarlath Quinn explains what cluster analysis is, how it is applied in the real world and how easy it is create your own cluster analysis models in SPSS Statistics.
-
![Introduction to the filter node in SPSS Modeler]()
Sometimes you may have problems with your data issues not related so much to the values of the data but to the fields themselves, such as awkward field names. The filter node is a really useful tool that offers a bunch of tricks for dealing with awkward fields.
-
![How to work with variable sets in SPSS Statistics]()
In this video we explore variable sets – a procedure in SPSS that allows you to generate subsets of variables or fields for display within dialogue boxes and in the data editor itself.
-
![Introduction to the generate menu in SPSS Modeler]()
Used correctly, the generate menu offers analysts some substantial time saving benefits. Watch this video to learn more about how you can use the generate menu effectively.
-
![How to change the defaults in SPSS Statistics]()
SPSS enables quite a high level of customisation so you can set up the software in a way that enables you to be a lot more productive, however many people are unaware of just how powerful these customisation options are. In this video we explore the options edit menu.
-
![Introduction to the data audit node in SPSS Modeler]()
The data audit node is a powerful tool you can use to help understand the shape and structure of your data before your analysis begins. You can also make some decisions here regarding how you might want to clean up your data, for example by dealing with missing values or extremes and outliers.
-
![Affinity analysis made easy]()
This short video shows how you can perform a simple affinity analysis using IBM SPSS Modeler. Affinity analysis can be used to understand interconnected relationships between key factors. For example, in retail it can be used to perform basket analysis, whereby retailers can identify which products are most commonly purchased together by customers in a…
-
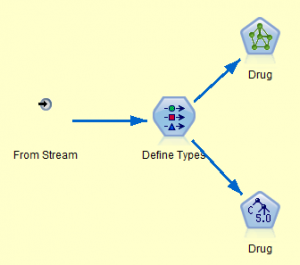
![Building a predictive model in SPSS Modeler]()
If you are considering making your first foray into predictive analytics or are interested in seeing the automated capabilities of IBM’s flagship analytical platform, this video will demonstrate the power and ease of building a predictive model in SPSS Modeler.
-
-
-
![How do I know which SPSS modules I have installed?]()
How do I know which SPSS modules I have installed?
-
![What is in each SPSS Statistics module?]()
What is in each SPSS Statistics module?
-
![What analytical procedures are included in IBM SPSS Statistics Base?]()
What analytical procedures are included in IBM SPSS Statistics Base?
-
![How to perform meta analysis in SPSS Statistics]()
How to perform meta analysis in SPSS Statistics
-
![What is the data science and statistics universe?]()
What is the data science and statistics universe?
-
![Creating data from SPSS output]()
Creating data from SPSS output
-
![Working with string variables in SPSS]()
Working with string variables in SPSS
-
![How do I upgrade to SPSS v32?]()
How do I upgrade to SPSS v32?
-
![What is correlation and when is it useful?]()
What is correlation and when is it useful?
-
![What is a Chi Square test and when would you use it?]()
What is a Chi Square test and when would you use it?
-
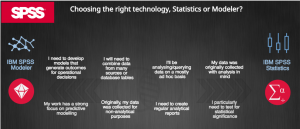
![What is the difference between the various types of statistical models?]()
What is the difference between the various types of statistical models?
-
![How do I choose the correct statistical test?]()
How do I choose the correct statistical test?
-
![What’s the difference between the various SPSS license types?]()
What’s the difference between the various SPSS license types?
-
![How do I transfer my SPSS license to another machine?]()
How do I transfer my SPSS license to another machine?
-
![How do I change the language in SPSS?]()
How do I change the language in SPSS?
-
![How does the SPSS license manager work?]()
How does the SPSS license manager work?
-
![How do I update my SPSS activation code?]()
How do I update my SPSS activation code?
-