Like a lot of consultants working in the analytics industry, I’ve built up an extensive portfolio of materials to illustrate different kinds of applications and approaches. Some of these consist of files and slide decks used to explain quite esoteric procedures such as TURF analysis or Partial Least Squares. However, there are certain materials that can be used to demonstrate such a wide number of statistical and predictive analytics techniques, that I’ve found myself immediately reaching for them again and again over the years. One of these is the SPSS Statistics sample dataset ‘Employee data.sav’.
Most statistical software programs come complete with a set of sample data files and SPSS Statistics is no exception with over 140 separate files that are referenced throughout the system’s in-built tutorial functions. The file ‘Employee data.sav’ however, is that rare and valuable thing for those teaching statistics: a great ‘all-rounder’.
The reasons for this are threefold. Firstly, the context of the file is easy for people to understand: it consists of 474 records where each row represents a different employee and the columns include variables such as gender, ethnic minority category, salary information, as well as data related to the employees ‘education level and professional experience. Secondly, the variables themselves are a good mix of categorical and continuous so that it’s possible to demonstrate a wide range of charts and statistical techniques from basic descriptive analysis up to predictive modelling. Lastly, the data itself has an interesting back story: it was used as evidence in an equal opportunity court case involving alleged wage discrimination within a US bank.
In fact, before it was ‘Employee data.sav’ the file was called simply ‘BANK.SAV’. Although the original data file had been in the public domain for decades, at some point, someone within SPSS Inc decided to ‘update’ the values in the data so that the salaries would appear to be more in line with contemporary wages. They seemed to do this by multiplying the salary distributions by a factor of 2.5.
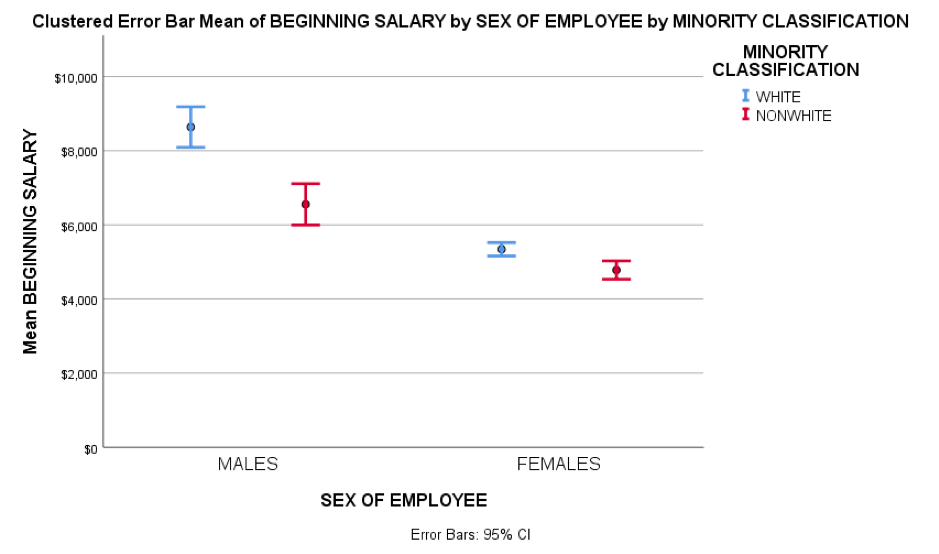
Moreover, the original ‘Bank.sav’ file has quite a pedigree as it appears in several textbooks and research papers over a thirty-year period. In 2000 it makes an appearance in the journal Race, Gender & Class where it forms the basis of the article ‘Multinomial Logistic Regression of Race and Gender Biases in Clerical Worker Wages’ paper by Rodney L. Brod and Karen M. Foote. The point of the paper is to demonstrate how a technique like logistic regression can be used to “reveal significant biases in beginning and current wages among race and gender groups of bank clerical workers. These wage differences persist even when holding constant education, previous work experience, age, and job seniority.” The authors describe the dataset as consisting of “474 persons employed between 1969 and 1971 by a Midwestern Bank”.
However, a little more detective work leads, appropriately enough, to Fred Ramsey and Daniel Schafer’s seminal book “The Statistical Sleuth: A Course in Methods of Data Analysis” where the data are used to highlight sex discrimination. The authors attribute the dataset to H. V. Roberts’ 1979 paper “Harris Trust and Savings Bank: An Analysis of Employee Compensation”. Roberts’ original paper has since been cited 16 times including Mary W. Gray’s excellent article “Can Statistics Tell Us What We Do Not Want to Hear? The Case of Complex Salary Structures” (1993).
As for the court case itself, it’s one of the best examples of where the power of statistics can be deployed to ensure social justice. In ‘A Practical Guide to Equal Employment Opportunity’ by Walter B. Connolly, Jr. and Michael J. Connolly (2006) the authors state that in the case of United States Department of the Treasury vs Harris Trust and Savings Bank (No 78-OFCCP-2 Jan 31 1981), from findings “based primarily on statistical evidence”, the judge found that there was “persuasive discrimination against minorities and women in the bank’s pay and promotion policies”.