This series of videos shows you how to work effectively with charts in SPSS Statistics, demonstrating some of the most popular charting procedures.
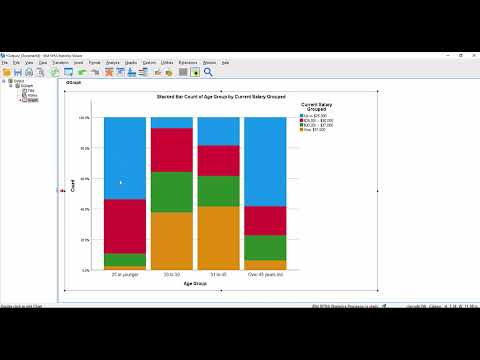
Creating stacked bar charts scaled to 100%
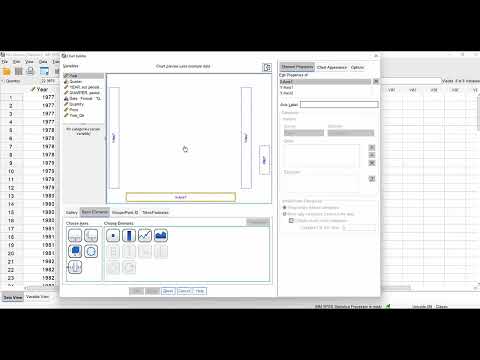
Creating dual axes line charts
Creating charts from tables
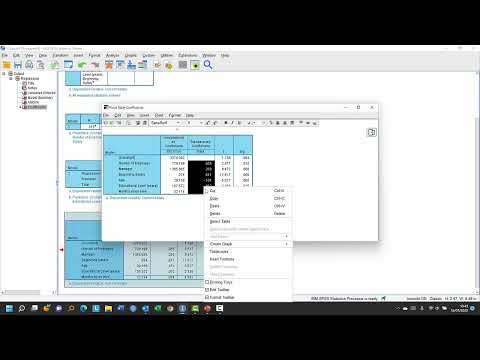
Pasting charts as Microsoft Office graphics objects
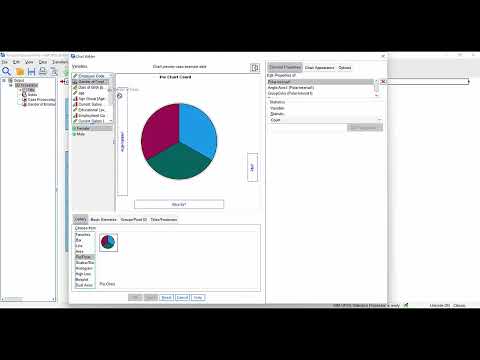
Creating panelled pie charts