In this four-part blog series, we’re going to take a look at working with R in SPSS. We’ll begin by exploring the basics of running R procedures in SPSS syntax and end up showing you how to create your own SPSS custom dialogs based on R code.
We’re able to run R code in SPSS Statistics 29.0 thanks to the R Integration Package for IBM® SPSS®. The package itself includes an integration plug-in for R which is installed alongside IBM SPSS Statistics. Earlier versions of SPSS Statistics may require the user to download and install the plug-in separately. They will also need to download and install the R program itself. However, starting with SPSS Statistics 29.0, R 4.2 is actually part of the product, so users will have everything they require to immediately begin running R programs within SPSS Statistics. Those who need to work with an existing external R distribution, can point SPSS Statistics to the program’s home directory by clicking Edit > Options… > File Locations > R Location > Other installation of R.
There are already plenty of materials available on the web aimed at helping users with learning R. YouTube alone has dozens of videos dedicated to this very subject. In this section, we’ll introduce you to some of the very basic concepts, but if you’re entirely new to R programming, you might want to consider doing a little further research before trying to run your own code in SPSS Statistics.
The first thing to understand about working with R in SPSS is that R is called via SPSS syntax with the following command:
BEGIN PROGRAM R.This invokes the R program itself, and so anything that follows this command is assumed to be R code. In the same way, the command to tell SPSS to close the external program session is simply:
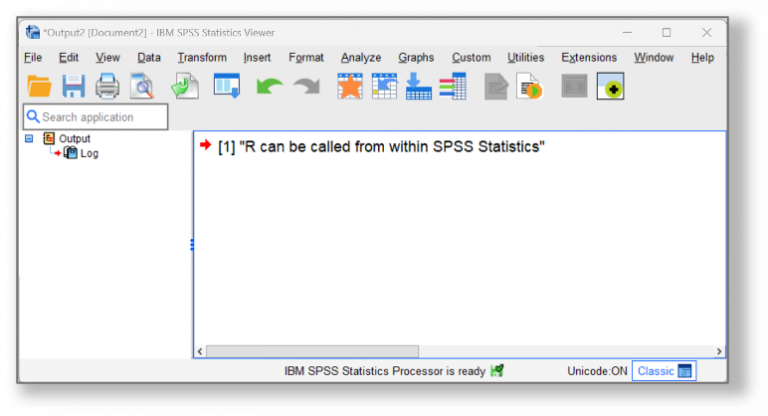
END PROGRAM.A simple way to test if R can be called from SPSS, is to open a new syntax window and request that R display a message. For example, by typing :
BEGIN PROGRAM R.
"R can be called from within SPSS Statistics"
END PROGRAM.
If this runs successfully, you should see the following text displayed in the system Log output within the SPSS Viewer window (note: you may have to double-click the Log icon in the Viewer window so that it appears as an open book).
When working in SPSS Statistics, we can execute special R code functions that interact with an active SPSS dataset. For example, the function spssdata.GetDataFromSPSS reads the case data from an active dataset and, by default, stores it to an R data frame. In fact, R works with several different data-related object types, but a data frame is the closest thing to what most people think of as a data file. This function is therefore essential in order to get R to run a huge number of procedures on data within SPSS Statistics. Consider the following syntax:
BEGIN PROGRAM R.
casedata <- spssdata.GetDataFromSPSS()
str(casedata)
END PROGRAM.
This command contains three essential elements:
Firstly, spssdata.GetDataFromSPSS() reads the currently open data file.
Secondly, the text casedata <- tells R to store the datafile as an object called casedata. The assignment operator <- acts an equals sign, which we could also use here, but many R aficionados prefer to this particular combination of symbols when assigning objects, as equals signs are often used as part of specific routines. In this case, as the SPSS data is being read as a data frame, R also stores it as a data frame.
Thirdly, the procedure str(casedata)tells R to check the structure of the newly assigned data frame object casedata.
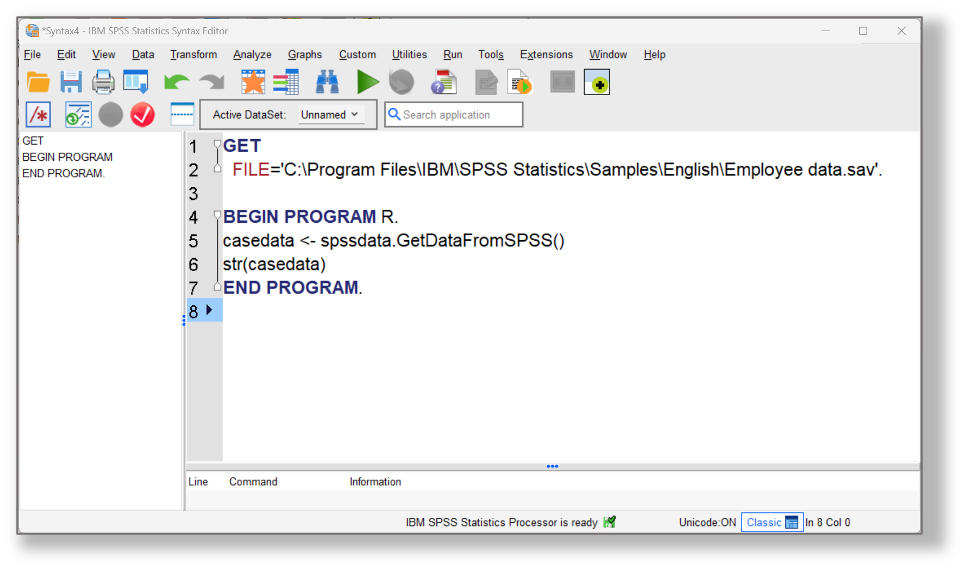
You may notice from the screenshot that we have preceded this R particular code block with an SPSS syntax Get File command in order to open the sample dataset Employee Data.sav. The results of the running the procedure are as follows.
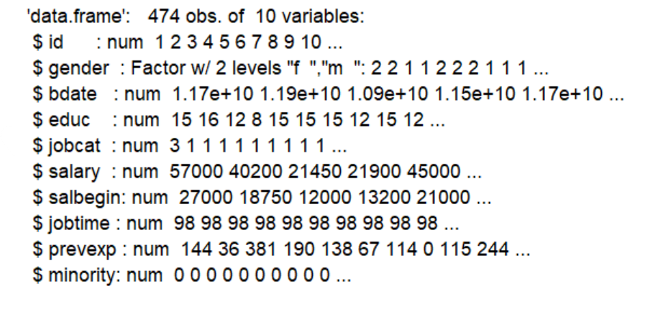
The R procedure output informs us the object is a data frame consisting of 474 observations and 10 variables. The variables are then listed, with a label indicating if they are numeric (num) or string (factor) and includes a preview of the first 10 values in each field. Note that R prefixes each variable name with a $ sign.
You may have noticed that the output showed that R read the variable bdate as a numeric field rather than a date variable that records each employee’s date of birth. You may also have noticed that the spssdata.GetDataFromSPSS()has a pair of parentheses at the end. That’s because this rich function affords many options with regard to how the data frame should be read (more details are available here).
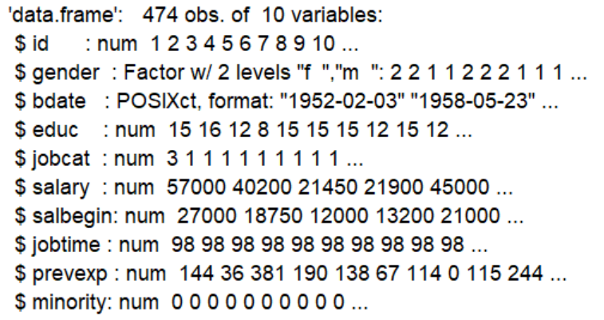
For example, if we edit the function so that it reads:
casedata <- spssdata.GetDataFromSPSS(rDate="POSIXct")We are instructing R to read any SPSS date variables as R date/time (POSIXt) objects rather than numerical fields, which is the default. We can see that by adding this condition, the new output from the structure command shows that bdate has indeed been read as a date variable.
In R, factor variables are the equivalent of categorical variables in SPSS. However, when reading an SPSS file using our special spssdata.GetDataFromSPSS function, categorical variables are only read as factors if they are string. To read the SPSS categorical variables as R factors, we can use the factorMode argument. Furthermore, by specifying the additional argument labels we can request that any categorical variables are converted to factors whose levels are the value labels of the variables. So now the command looks like:
casedata <- spssdata.GetDataFromSPSS(rDate="POSIXct", factorMode="labels")Moreover we can replace the str() procedure with the head()procedure which (by default) allows us a preview of the first 6 rows of data. So now, running the syntax…
BEGIN PROGRAM R.
casedata <- spssdata.GetDataFromSPSS(rDate="POSIXct", factorMode="labels")
head(casedata)
END PROGRAM.
…results in a preview of the first 6 cases where we can see that the employee dates of birth are correctly displayed as a date field and the value labels for the variables gender, jobcat and minority have been read as raw data values.

We can also ‘comment out’ sections of code that we don’t want to run, by using a hashtag # character. In the following example, we are telling R to ignore the first two procedures simply by adding a hashtag before each relevant line in the code.
BEGIN PROGRAM R.
#casedata <- spssdata.GetDataFromSPSS(rDate="POSIXct", factorMode="labels")
#head(casedata)
subset <- spssdata.GetDataFromSPSS(rDate="POSIXct", factorMode="labels", variables=c("bdate TO salbegin"))
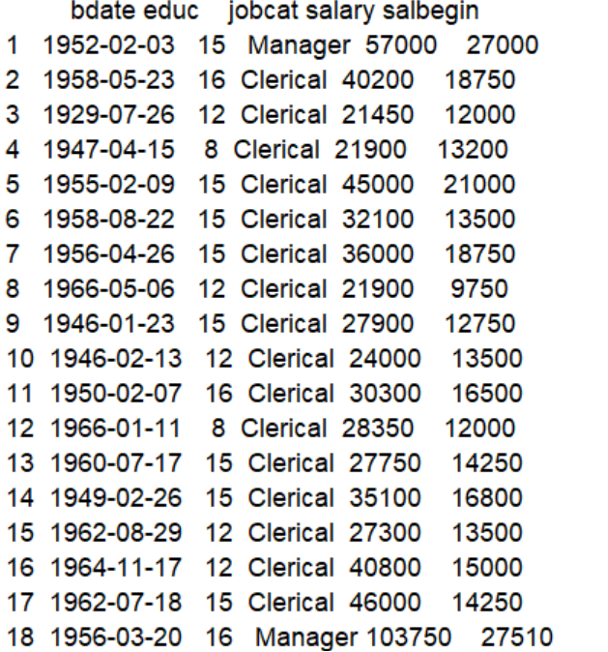
print (subset)
END PROGRAMYou can also see that we have added some code to create an additional data frame called subset. This data frame is based on a subgroup of the variables from the active SPSS dataset. We’ve done this by adding the variables argument to the SPSS data procedure. Here, the statement variables=c(“bdate TO salbegin”) tells R to only extract the fields bdate, salbegin and all variables between them from the active dataset. Also note the use of the function c(). This is a very commonly used R procedure that allows us to join objects together. Lastly, the command print (subset)simply prints out the subset data frame as a list.
In Part 2 of this blog series, we will continue our exploration of running R in SPSS Statistics and see how we can install and call an R package to generate colourful correlograms.