The Regular Expressions for IBM SPSS Modeler node pack provides 4 nodes that integrate the power and flexibility of regular expression pattern matching into SPSS Modeler. However, some of these capabilities can be supported using the extension nodes built into SPSS Modeler and that begs the question – why buy the Regular Expression nodes?
One obvious answer is ease of use. The extension nodes built into SPSS Modeler require expertise in either R or Python programming languages since they are general “code” nodes. Although many data scientists may already have that expertise, most people use SPSS Modeler because of its visual, non-programming approach to predictive analytics and machine learning. Requiring all users to be familiar with R or Python defeats the point of using an intuitive, visually-focussed platform.
An additional complexity is that when using the extension nodes, the underlying code must compute the output fields for itself, whereas this is computed automatically by the Regular Expression nodes. This, combined with the easy to use controls, make development and maintenance much simpler with the Regular Expression nodes.
A further consideration is performance. The built-in extension nodes call out to separate processes and that need to copy the whole data set to, and then read it back from, that process. This adds an extra overhead that the Regular Expression nodes do not have since they run within the SPSS Modeler process. In fact, the difference in performance is not trivial.
Test Data
To test out the performance, we created a small stream that uses the NASA access log data set. This data set contains 1,569,898 rows of website log data from August 1995 with a single field containing the full log entry. For example:
slppp6.intermind.net - - [01/Aug/1995:00:00:12 -0400] "GET /images/ksclogosmall.gif HTTP/1.0" 200 3635

ix-esc-ca2-07.ix.netcom.com - - [01/Aug/1995:00:00:12 -0400] "GET /history/apollo/images/apollo-logo1.gif HTTP/1.0" 200 1173

slppp6.intermind.net - - [01/Aug/1995:00:00:13 -0400] "GET /history/apollo/images/apollo-logo.gif HTTP/1.0" 200 3047

uplherc.upl.com - - [01/Aug/1995:00:00:14 -0400] "GET /images/NASA-logosmall.gif HTTP/1.0" 304 0

133.43.96.45 - - [01/Aug/1995:00:00:16 -0400] "GET /shuttle/missions/sts-69/mission-sts-69.html HTTP/1.0" 200 10566
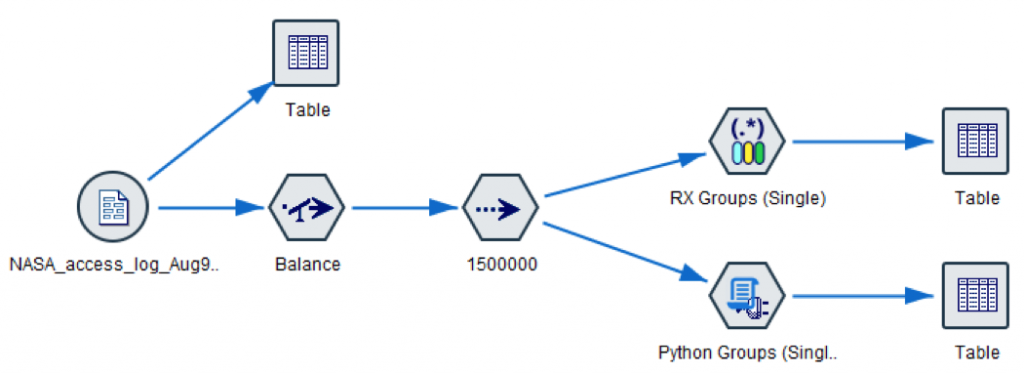
Benchmark Stream
Because we wanted to test up to 3,000,000 records, the stream used a Balance node to double the number of records to a little over 3 million rows, and then used a sample node to control the number of rows passed to an RX Group node (which is one of the Regular Expression nodes) and then for comparison an extension node using Python for Spark (PySpark). This approach ensured consistent performance in the data preparation steps up to the nodes being tested.
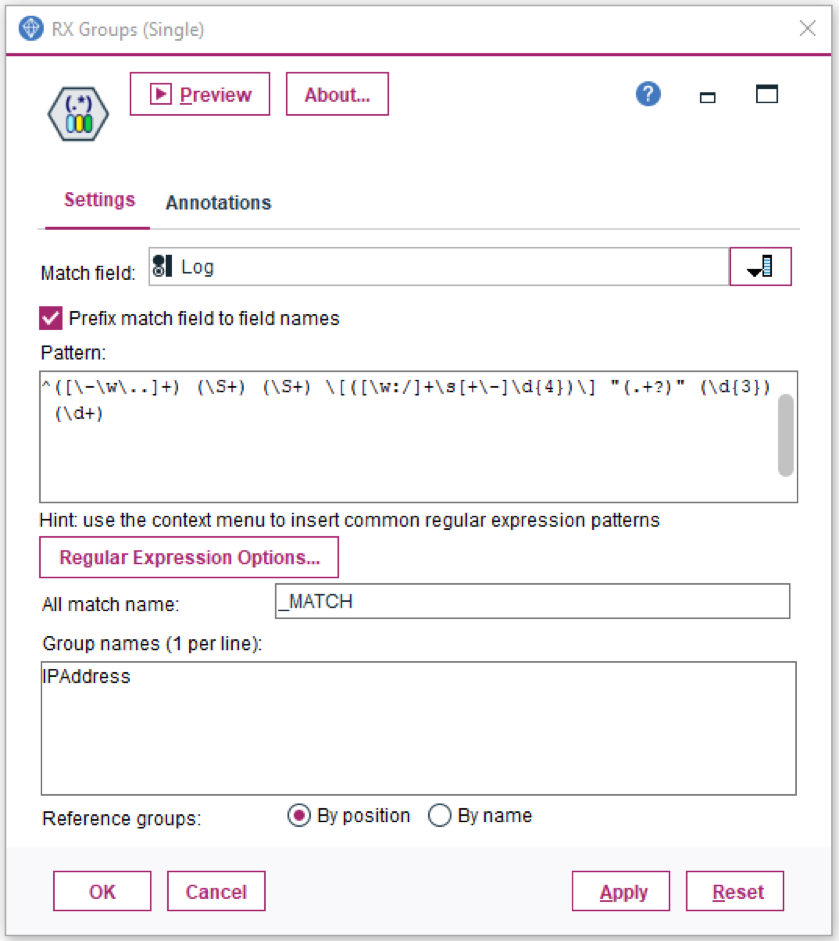
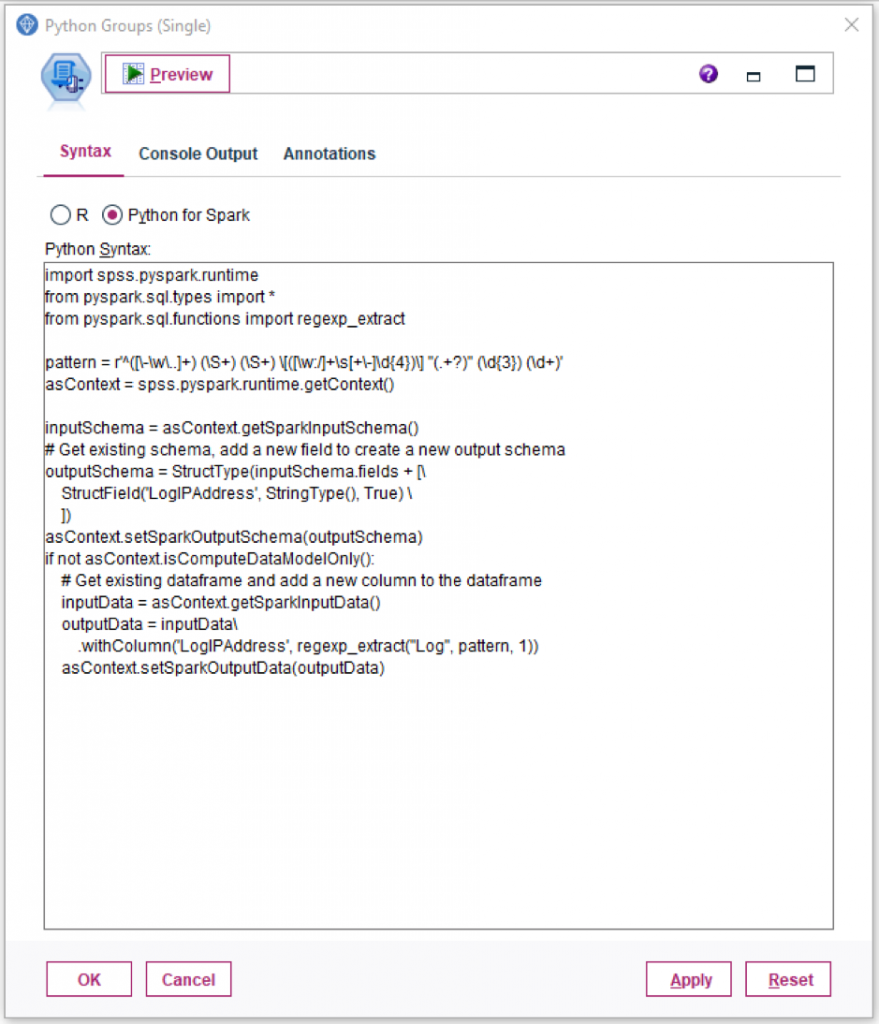
Each node used the same regular expression to match the components in the Log field:
^([\-\w\..]+) (\S+) (\S+) \[([\w:/]+\s[+\-]\d{4})\] "(.+?)" (\d{3}) (\d+)
The actual settings for each node are shown in the following images:
To run the benchmarks for each node, the stream was loaded into SPSS Modeler 18.2 running in desktop mode on a PC with the following configuration:
- Intel Core i7-4790 @3.60GHz
- 24Gb RAM
- Seagate 2TB 7200RPM HD
- Windows 10 Pro 64 bit
Prior to the first test, the nodes were executed once to ensure all the relevant processes and libraries had been “warmed up”. Each node and sample size iteration was executed 3 times, and the CPU and elapsed times reported by SPSS Modeler were recorded and averaged.
Test Results
The results for each node are shown below:
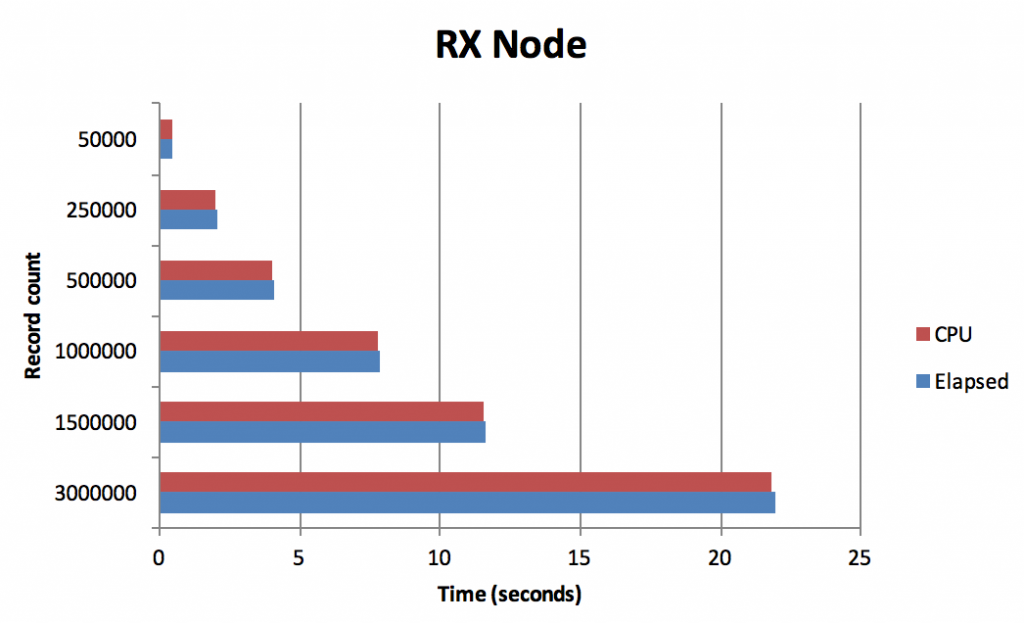
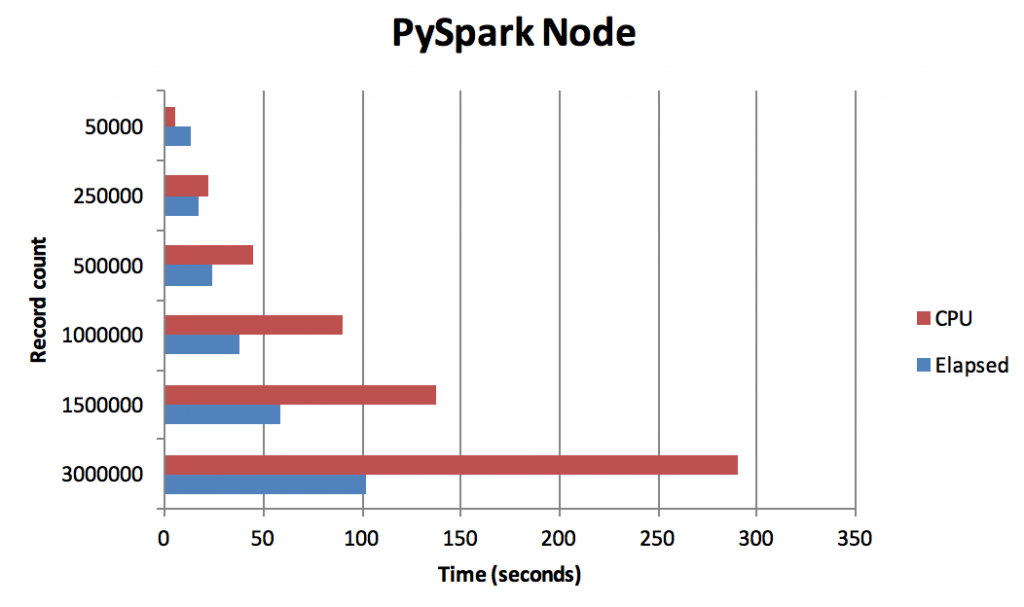
One thing that is apparent from these graphs is the relationship between CPU and Elapsed is different in the two nodes:
- In the RX Groups node, the CPU and Elapsed times are largely consistent because the values are processed within the SPSS Modeler backend process on a “1 row in, 1 row out” basis
- In the PySpark extension node, CPU usage increases dramatically over Elapsed. This is likely because the PySpark runtime creates multiple workers to process the data in parallel (the Spark settings used are the default that are shipped with SPSS Modeler 18.2)
Comparing the performance of Elapsed and CPU time between the two nodes gives a much clearer picture:
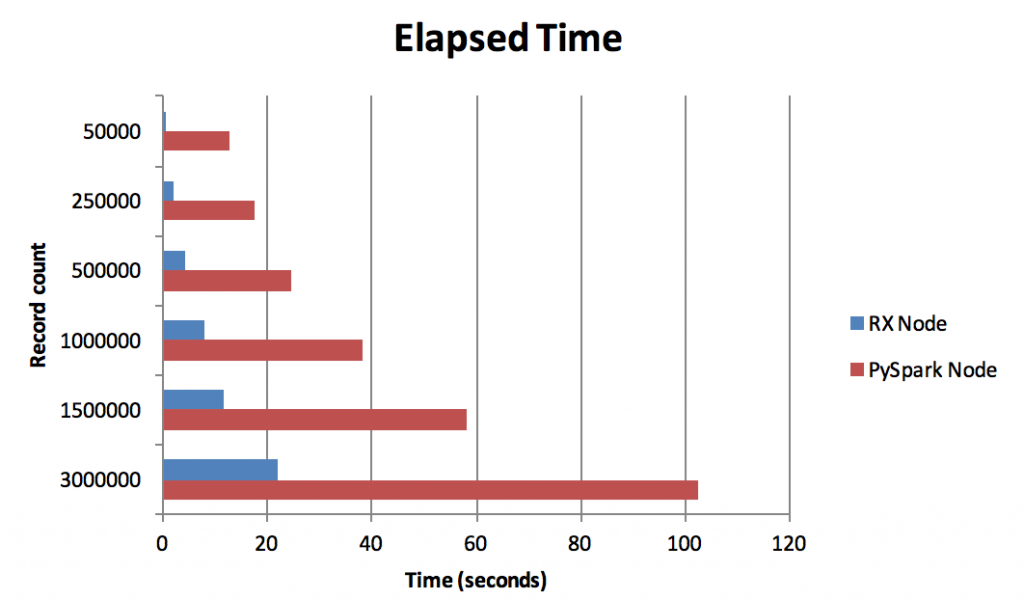
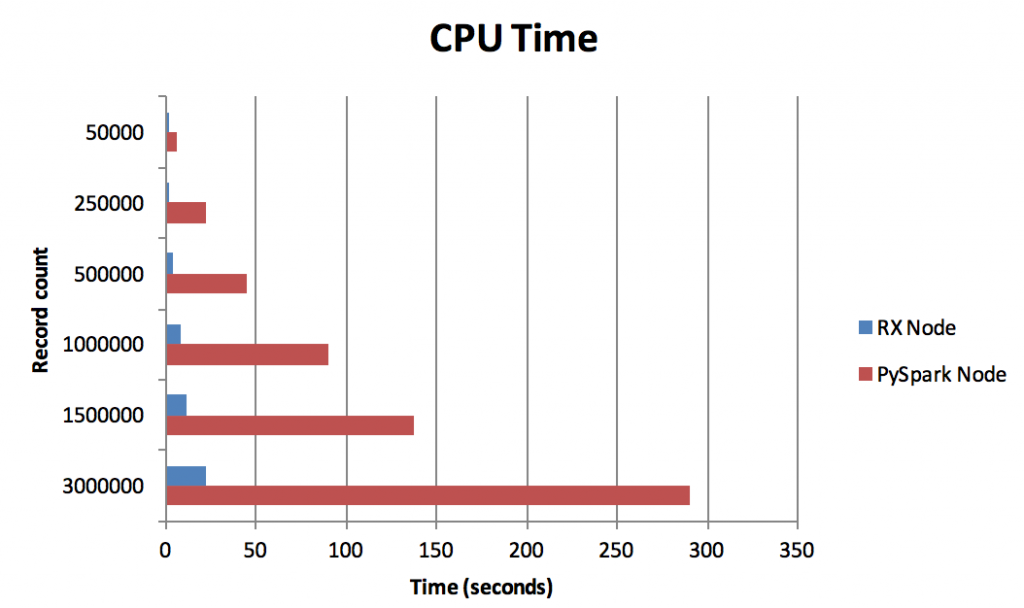
For each measure, the RX Group node is significantly faster (Elapsed time) and uses fewer system resources (CPU time) than the PySpark node. Even if the costs of system resources are ignored, the RX Group node is nearly 5 times faster than the PySpark node when processing 3 million records and this difference in speed will affect any subsequent nodes downstream of the regular expression nodes.
Conclusion
The results obtained from these tests show the benefits of using the Regular Expression nodes and avoiding the performance bottleneck of using the built-in extension nodes for regular expression processing. When the increased speed is combined with the usability and maintainability provided by the user interface, the advantages of Regular Expressions for IBM SPSS Modeler node pack become clear.
Next steps
Download our Regular Expressions for IBM SPSS Modeler node pack.
Book on our webinar to find out more about how this node pack works.