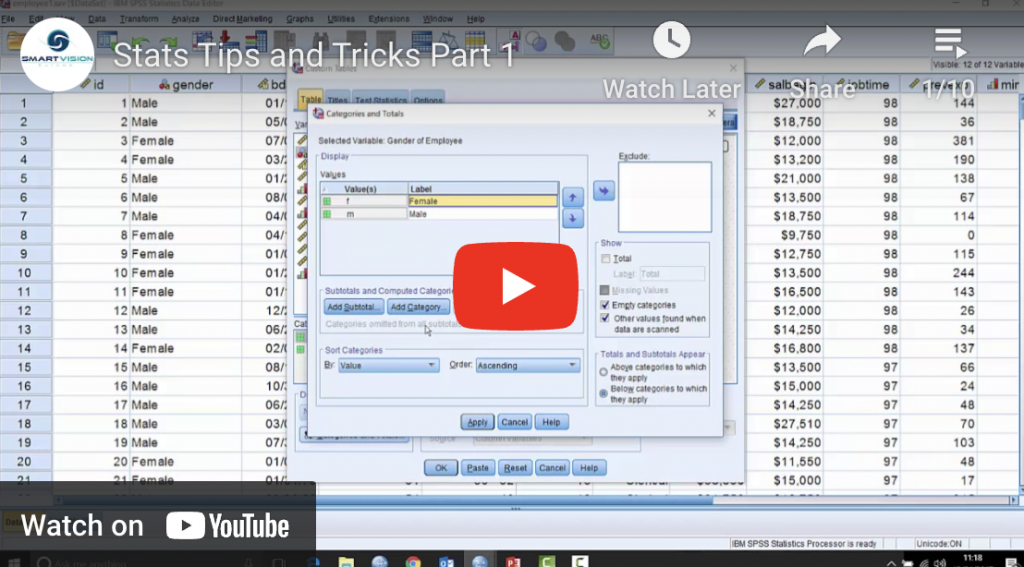
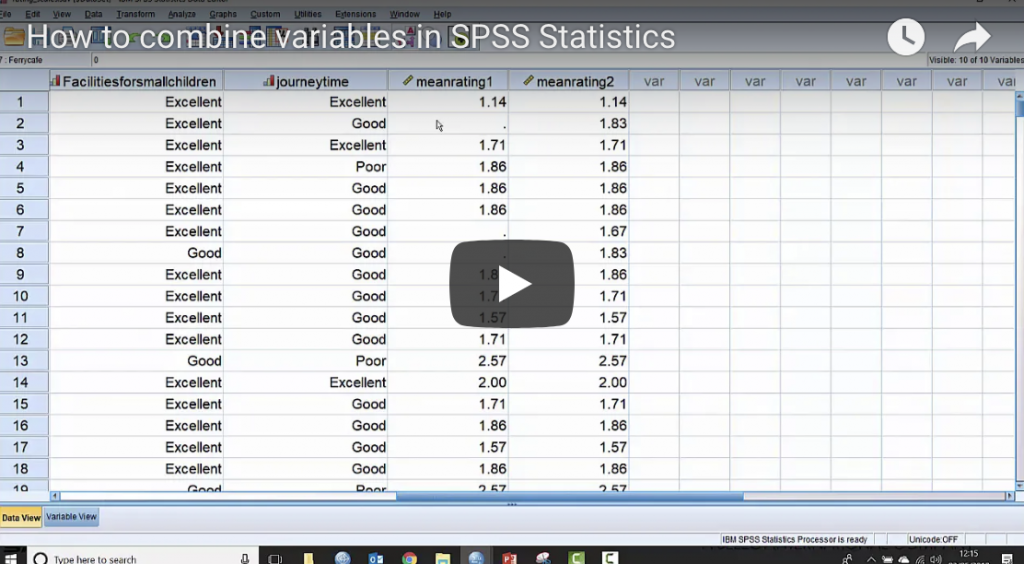
How to combine variables in SPSS Statistics

SPSS users often want to know how they can combine variables together. In this video Jarlath Quinn demonstrates how to use the compute procedure to calculate the mean of a number of variables to create one combined variable, and also how to use the count values procedure to count how many times a particular value occurs across a series of variables in order to create an overall count.

5 key trends affecting technical training provision in predictive analytics

I have been in the business of delivering software applications and solutions that have advanced and predictive analytics at their core, in one form or another, for last 25 years. In a recent conversation with colleagues we were discussing how the wider market has changed and, more specifically, how this has affected the way that …

5 key trends affecting technical training provision in predictive analytics Read More »

Expert insight – Matt Harrop, Head of Yield Management and Analytics, Ladbrokes Coral Ltd

What’s your background? How did you come to be working in analytics? I came from an accounting background and then moved into retail where I worked across a variety of teams in finance, marketing analytics and strategy for various different retailers. I then left that to join a consultancy working with loyalty card data. I …

Expert insight – Matt Harrop, Head of Yield Management and Analytics, Ladbrokes Coral Ltd Read More »

7 things you need to know about key driver analysis (KDA)

In most businesses it’s not enough to simply be measuring outcomes like customer satisfaction, sales, customer churn rates, subscription renewals, customer loyalty, cancellation rates and so on. To gain competitive advantage you also need to know what’s driving those outcomes. Which aspects of the service you provide most influence how likely someone is to renew …

7 things you need to know about key driver analysis (KDA) Read More »

The benefits of survey research and how online platforms can make the research process more efficient and effective

Surveys remain one of the most popular forms of market research, and consequently we regularly work with customers on large survey-based market research projects. Most commonly this is customer satisfaction surveys, and these can be one of the most valuable forms of data that a company has. We also have clients who conduct broader market …

The benefits of survey research and how online platforms can make the research process more efficient and effective Read More »

How to ensure advanced analytics gives you a concrete competitive advantage

Most companies these days are aware of the potential value that advanced analytics could offer them. Lots of people are talking the talk of advanced analytics, hiring data scientists and investing in sophisticated analytics technologies. But these things on their own aren’t going to give you the competitive advantage that you’re hoping for. It’s not …

How to ensure advanced analytics gives you a concrete competitive advantage Read More »

TURF analysis with SPSS Statistics

In this video Jarlath Quinn introduces the popular TURF analysis technique and demonstrates how to apply it in IBM SPSS Statistics. TURF analysis is used in many industries to find the optimal sub-group of options from a wider portfolio in order to maximise their appeal to an audience or market.

Introduction to the filter node in SPSS Modeler

Sometimes you may have problems with your data issues not related so much to the values of the data but to the fields themselves, such as awkward field names. The filter node is a really useful tool that offers a bunch of tricks for dealing with awkward fields.

How to change the defaults in SPSS Statistics

SPSS enables quite a high level of customisation so you can set up the software in a way that enables you to be a lot more productive, however many people are unaware of just how powerful these customisation options are. In this video we explore the options edit menu.

Introduction to the data audit node in SPSS Modeler

The data audit node is a powerful tool you can use to help understand the shape and structure of your data before your analysis begins. You can also make some decisions here regarding how you might want to clean up your data, for example by dealing with missing values or extremes and outliers.

What do we mean when we talk about data modelling? An overview of different types of models

The real world, whether it be the physical world, for example machines, or the natural world, for example human and animal behaviour, is very complex with many factors, some unknown, determining their behaviour and responses to interventions. Even if every contributory factor to a phenomenon is known, it is unrealistic to expect that the unique …

What do we mean when we talk about data modelling? An overview of different types of models Read More »

How alternative interfaces can help you get more out of R

Contemporary analytical platforms like SPSS and SAS represent the some of the earliest and yet longest-lived examples of proprietary software in the industry. When we think of the tectonic shifts the technology landscape has witnessed in last four decades, through the mainframe era, the rise of the PC, browser wars, the dotcom bubble, the smartphone …

How alternative interfaces can help you get more out of R Read More »

Why R can be hard to learn

Many of the analysts we speak to are being pushed over to R, primarily because it’s open source and therefore a free alternative to commercial data analytics packages for which the costs can sometimes run into tens of thousands of pounds (or more). However, even experienced analysts often find that getting to grips with R …

Why R can be hard to learn Read More »

What’s the difference between business intelligence and predictive analytics?

It’s not uncommon to talk to potential clients who consider themselves to already be very much data-driven in the way that they operate. However it’s very rare to find a potential client that truly is exploiting the full potential of the data that they hold. That’s because companies often confuse business intelligence with predictive analytics, …

What’s the difference between business intelligence and predictive analytics? Read More »

How repeatable application templates will maximise the effectiveness of your first predictive analytics project

As we help our clients get up and running with the predictive analytics tools and skills they need, we see some trends emerging in terms of the kind of applications for which clients tend to use predictive analytics most commonly. These are what we call ‘repeatable application templates’. In my previous post I outlined the 4 …

How repeatable application templates will maximise the effectiveness of your first predictive analytics project Read More »

Predictive operational analytics part 1

In part one of this video series Jarlath Quinn explains how operational analytics works, what data sources may be utilised and introduces the example case study that forms the basis of the subsequent videos in the series.

Predictive operational analytics part 2 – SPSS Modeler demo

In part two of our predictive operational analytics video series, Jarlath Quinn introduces the IBM SPSS Modeler Software before showing how to explore the example data from the case study and carry out text analytics of engineer logs to categorise the information and create key fields for further analysis.

Predictive promoter part 4 – text mining and conclusions

In this final part of  our predictive promoter video series, Jarlath Quinn tackles the project’s most ambitious task: mining the open-ended guest comments to uncover important insights. Here you can discover how we can use text analytics to extract a series of concepts and sentiments from customer comments in order to categorise the guests’ responses.

Four reasons why getting started with predictive analytics is simpler than you think

We spend a great deal of our time at Smart Vision helping our clients to establish the use of predictive analytics in their business. For many organisations, getting started with predictive analytics can feel like a real departure from more traditional and familiar areas of activity. That said, organisations in almost every industry sector are becoming …

Four reasons why getting started with predictive analytics is simpler than you think Read More »

Understanding what drives your net promoter score – how data science can help

The concept of the net promoter score was introduced to the world in Frederick Reichheld’s seminal Harvard Business Review article The One Number You Need to Grow in 2003. Reichheld’s research led him to believe that there was a deep and intrinsic link between profitable growth and customer loyalty. Two years of research revealed that, for most industries, …

Understanding what drives your net promoter score – how data science can help Read More »

Data science projects – what skills do you need and where can you get them from?

Data science is on the rise. A couple of years back Harvard Business Review suggested that ‘data scientist’ is the sexiest job title of the twenty first century and the hype around data science shows no sign of abating. The term ‘data scientist’ itself was only coined in 2008 but since then the number of data …

Data science projects – what skills do you need and where can you get them from? Read More »

What If Analysis using IBM SPSS Modeler Premium

In this short video Jarlath Quinn demonstrates how to use the powerful simulation tools within IBM SPSS Modeler to perform What If analysis (also known as ‘Scenario Planning’). What if analysis allows business-focused analysts to go beyond simple predictive modelling to evaluate the impact of different choices and scenarios on predicted outcomes.

Predicting asset failure using IBM SPSS Modeler

This video shows you how organisations with substantial capital assets can use IBM SPSS Modeler to predict when asset failure is most likely. Predicting asset failure can prevent problems before they happen and enables organisations to save money, reduce asset downtime and increase efficiency.

Affinity analysis made easy

This short video shows how you can perform a simple affinity analysis using IBM SPSS Modeler. Affinity analysis can be used to understand interconnected relationships between key factors. For example, in retail it can be used to perform basket analysis, whereby retailers can identify which products are most commonly purchased together by customers in a single transaction or over a given period time.

Download your free copy of our Understanding Significance Testing white paper
Subscribe to our email newsletter today to receive updates on the latest news, tutorials and events, and get your free copy of our latest white paper.
We respect your privacy. Your information is safe and will never be shared.
Don't miss out. Subscribe today.
×
×
WordPress Popup Plugin
Scroll to Top