Choosing a predictive analytics project
At Smart Vision we’re in a pretty strong position to talk authoritatively about the reality of predictive analytics. That’s because […]
Choosing a predictive analytics project Read More »
At Smart Vision we’re in a pretty strong position to talk authoritatively about the reality of predictive analytics. That’s because […]
Choosing a predictive analytics project Read More »
Like a lot of consultants working in the analytics industry, I’ve built up an extensive portfolio of materials to illustrate
Statistics in court: the story of a dataset Read More »
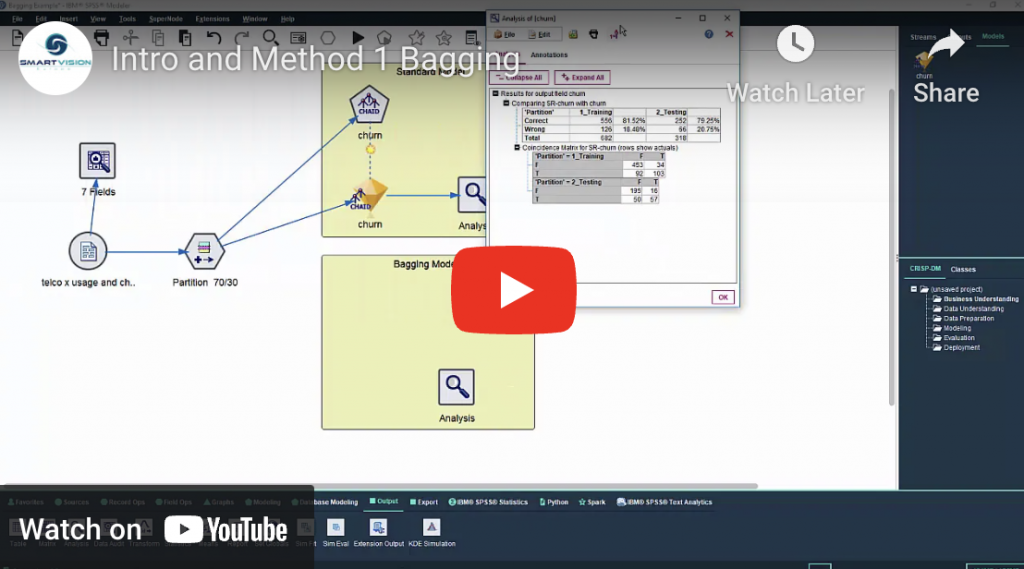
Bootstrap aggregation, also called bagging, is a random ensemble method designed to increase the stability and accuracy of models. It involves creating a series of models from the same training data set by randomly sampling with replacement the data.
6 secrets of building better models part one: bootstrap aggregation Read More »
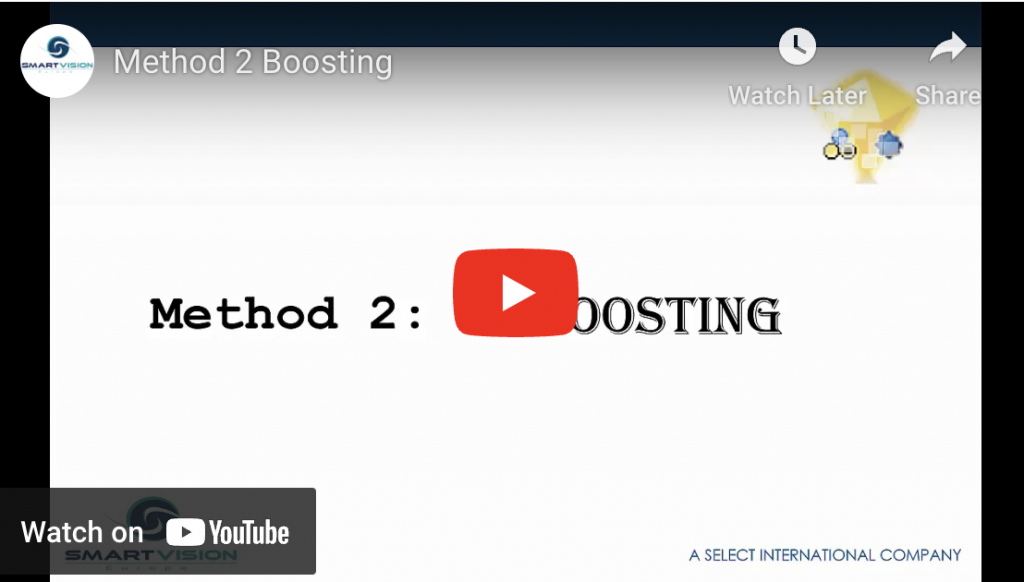
Boosting is another ensemble model-building method that was designed to help develop strong classification models from weak classifiers. Boosting methods focus on error (or misclassifications) that occur in prediction.
6 secrets of building better models part two: boosting Read More »
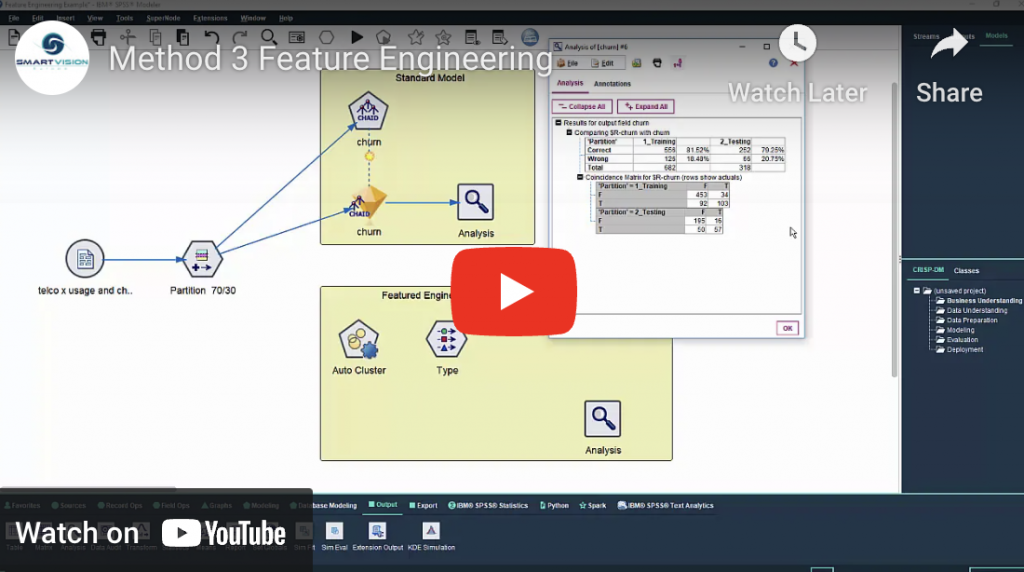
Feature Engineering is really just a fancy term for creating new data. Very often we can help an algorithm build better models by preparing the input data in a way that allows it to detect a clearer signal in the often noisy data. In machine learning variables are often referred to as ‘features’, so feature engineering refers to the transformation of variables or the creation of new ones.
6 secrets of building better models part three: feature engineering Read More »
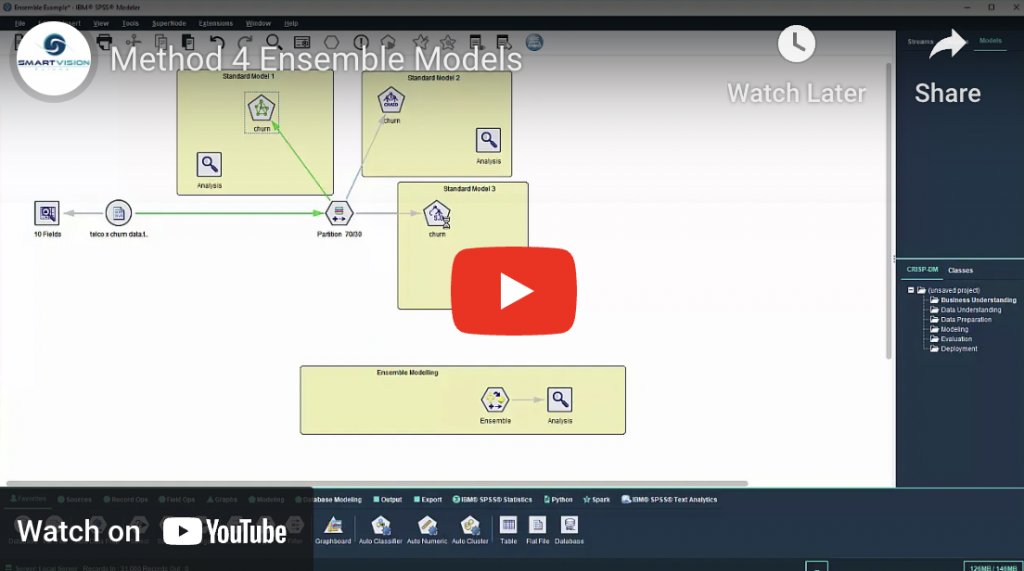
Ensemble modelling refers to the practice of combining the predictions of separate models on the old principle that “two heads are better than one”. Ensemble methods can be particularly effective when combining models that have been created using completely different algorithms.
6 secrets of building better models part four: ensemble modelling Read More »
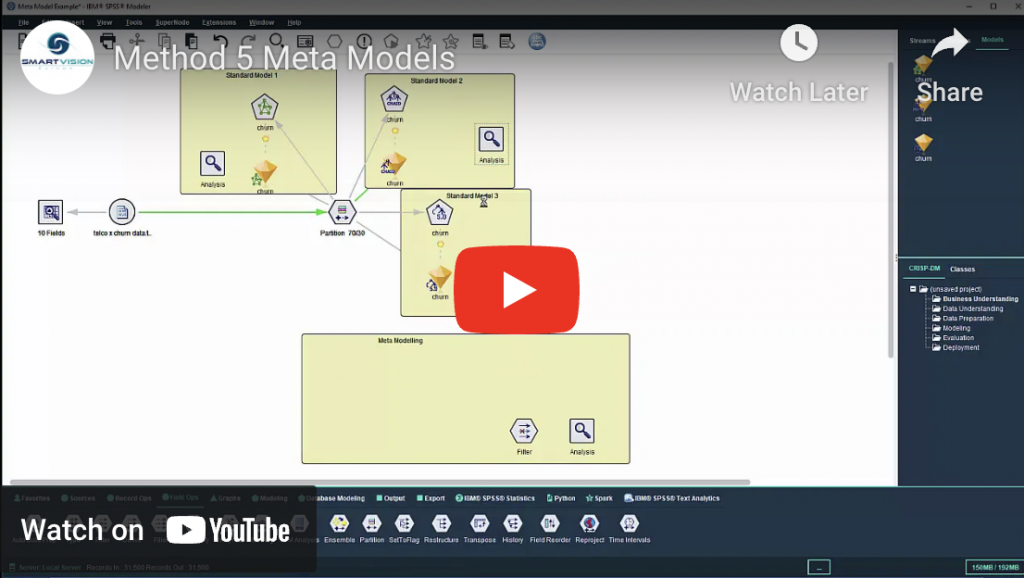
The idea of meta modelling is to build a predictive model using the predictions or scores generated by another model. By adding the predictive scores generated by an initial modelling algorithm to an existing pool of predictor fields, a second algorithm can then exploit these scores in to build a final more accurate model.
6 secrets of building better models part five: meta models Read More »
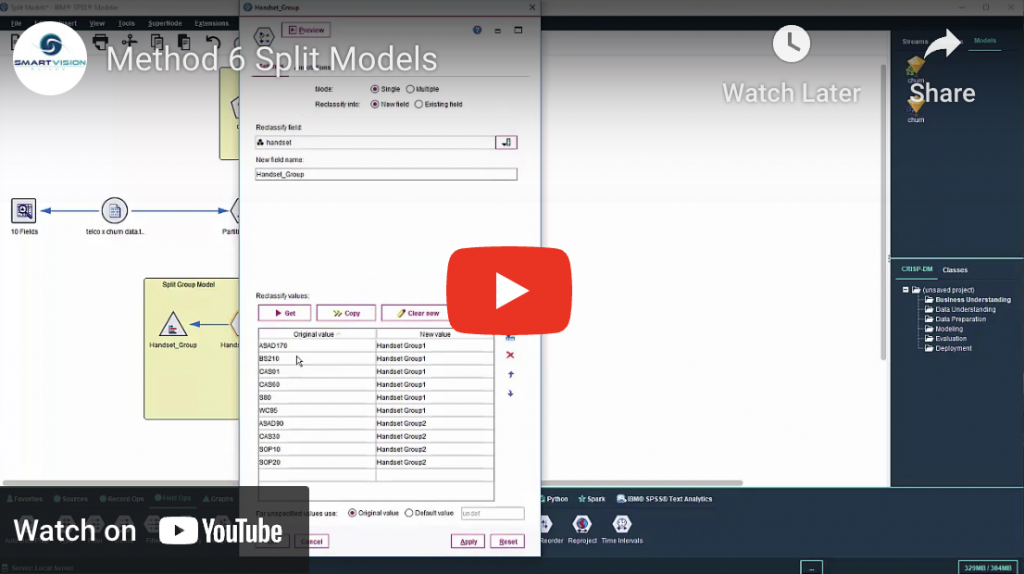
Split models or split population modelling is another technique that allows the user to build multiple models which can then be combined to create a single prediction. The idea with split modelling is that if the data represent different populations or contain separate groups that behave in very different ways, assuming that a single model can explain all the inherent variability across these distinct populations might be unreasonable.
6 secrets of building better models part six: split models Read More »
In April of this year, IBM released the latest version of SPSS Statistics. Version 26 introduces a number of additional
What’s new in IBM SPSS Statistics v26? Read More »

Lorna: Please could you start just by talking a little bit about your own background and how you’ve come to
Expert insight: Clifford Budge, Head of Ecommerce Data Science, major toy manufacturer Read More »
Here is an interesting confession. I work for an analytics company but I would really rather not think about or
I work for an analytics company, but I don’t want to talk about analytics Read More »
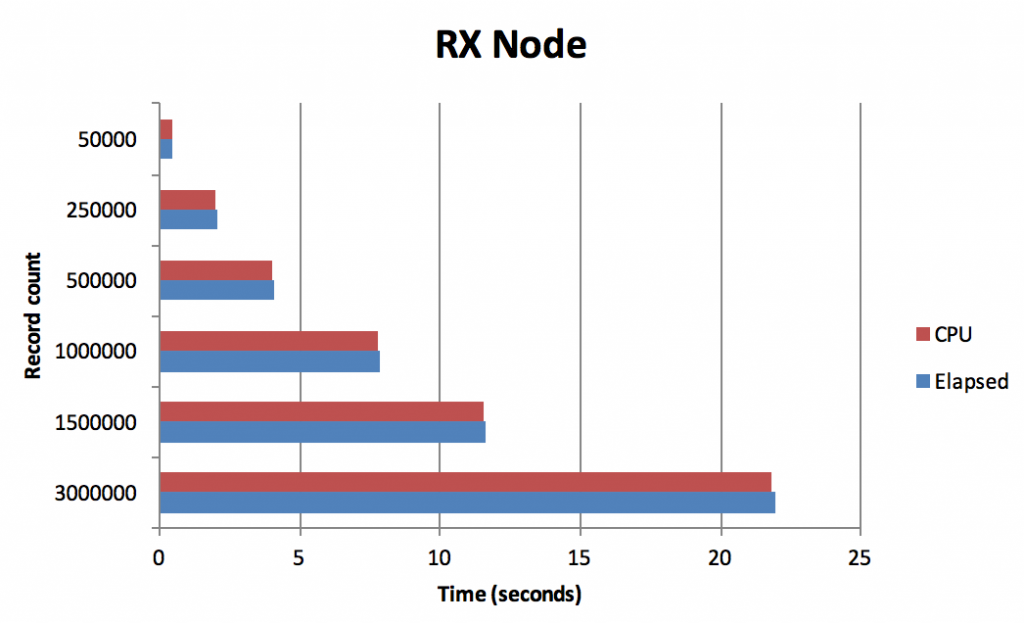
The Regular Expressions for IBM SPSS Modeler node pack provides 4 nodes that integrate the power and flexibility of regular
Regular Expressions for IBM SPSS Modeler: performance comparison Read More »
I was talking to a potential client recently who was frustrated by the lack of ‘real analysis’ happening in his
Don’t overlook the value of quick wins in your analytics project Read More »
In this video Jarlath Quinn takes a first look at SPSS Modeler v18.2 and demonstrates some of the new functionality that’s included within this release.
A first look at SPSS Modeler v18.2 Read More »

This year SPSS is 50 years old. Development started in 1965 by a team of political scientists, frustrated at how
Expert insights: Major Lester, founder of SPSS UK talks about fifty years of SPSS Read More »

You may have noticed by now that there seem to be a couple of recurring themes in the plethora of
Three questions to ask when reading articles about artificial intelligence Read More »
When we’re talking to potential clients about advanced analytics we often ask them what tools they’re currently using. More often
Thinking of using spreadsheets for advanced analytics? Think again. Read More »

Can you tell us a bit about yourself, your background and how you came to be where you are career-wise?
Expert insight – Paul Jackson, Head of Advanced Analytics, Bonamy Finch Read More »

Can you start off by telling us a bit about your background, and how you came to be working in
Expert insight – John Gill, Head of Insight and Analytics, Betfred Read More »
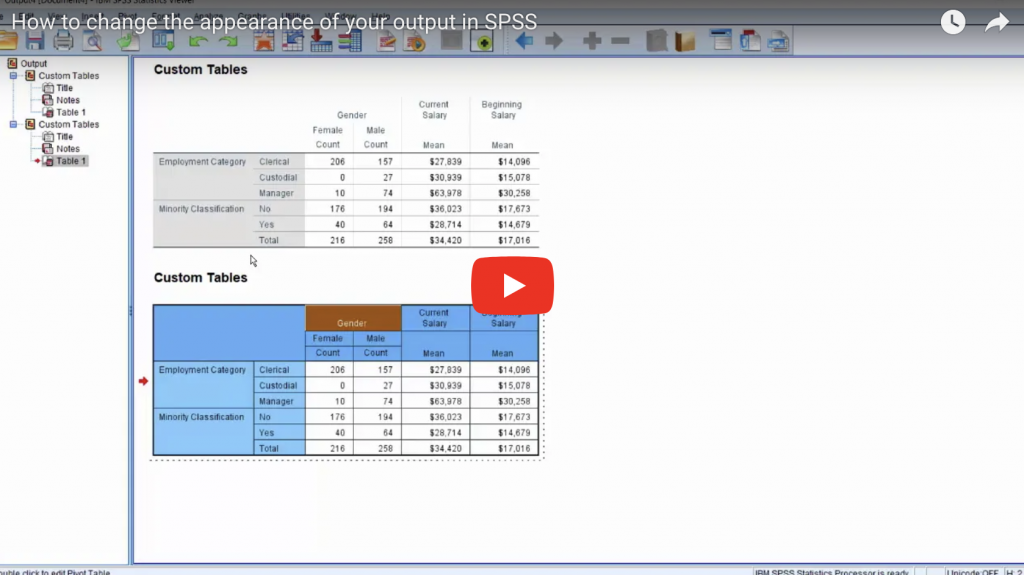
We’re often asked how you can change the appearance of the tables that SPSS generates as output. In this video Jarlath Quinn demonstrates two different ways to do this, either by choosing a different table look in the edit / options function, or by editing the table properties directly yourself.
How to change the appearance of your output in SPSS Statistics Read More »
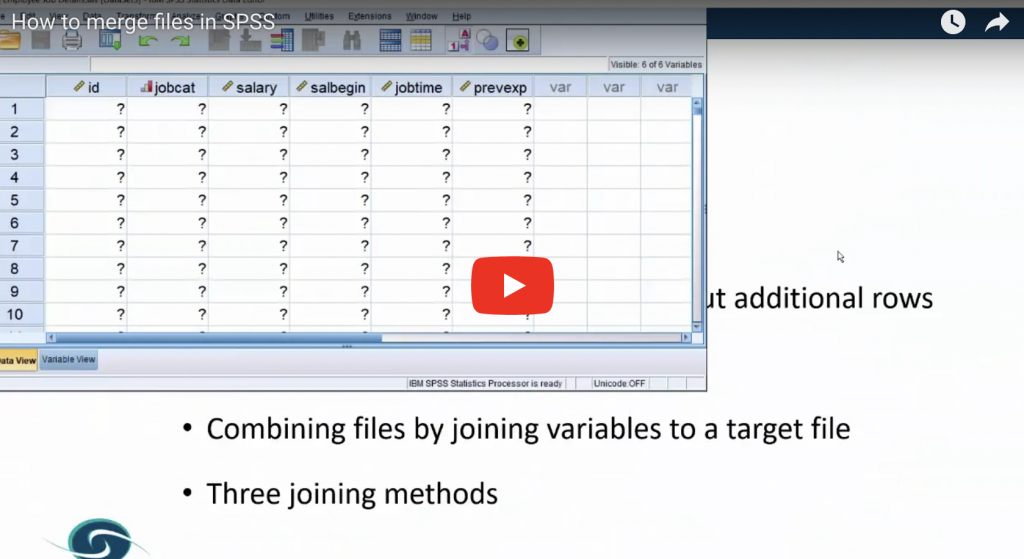
In this video Jarlath Quinn demonstrates how to merge data files within SPSS Statistics using each of the two main methods, either adding cases (combining files with the same fields but additional rows) or adding variables (combining files by joining variables to a target file using something like an ID field as a ‘keyed variable’).
How to merge files in SPSS Statistics Read More »
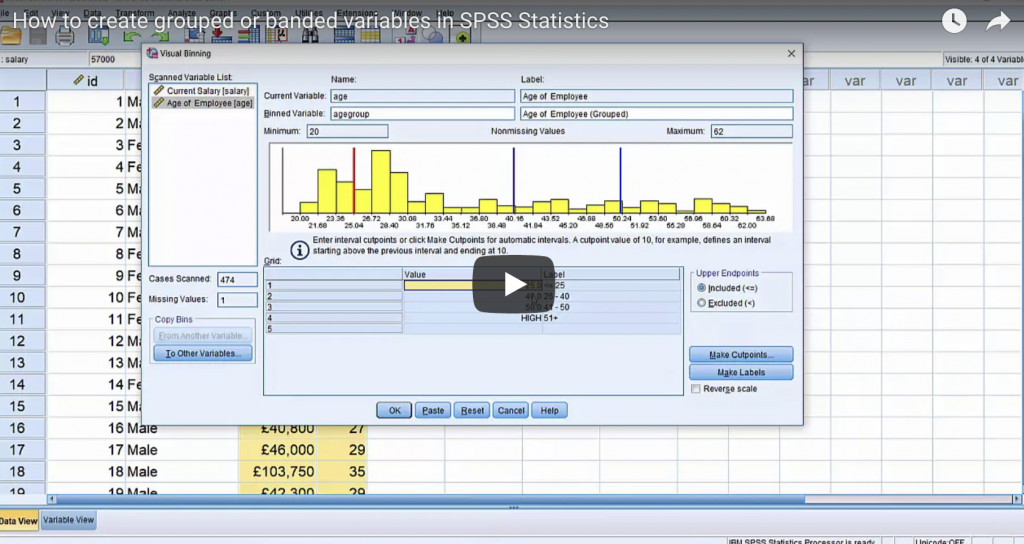
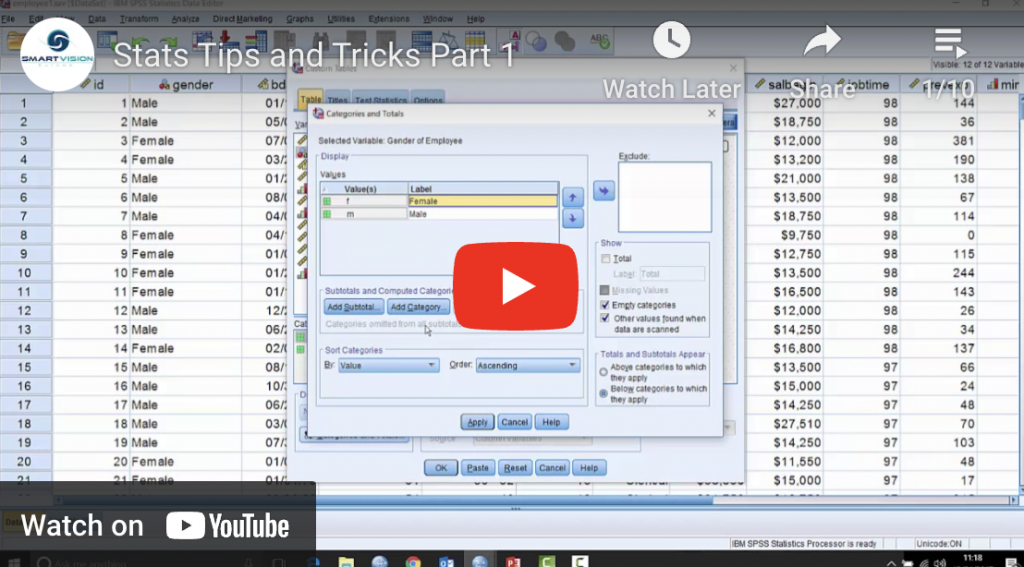
SPSS users often want to be able to create grouped or banded data from continuous fields such as, for example, creating age groups or income bands from continuous fields. In this video Jarlath Quinn demonstrates how to use the visual binning procedure within SPSS Statistics to do this.
How to create grouped or banded variables in SPSS Statistics Read More »
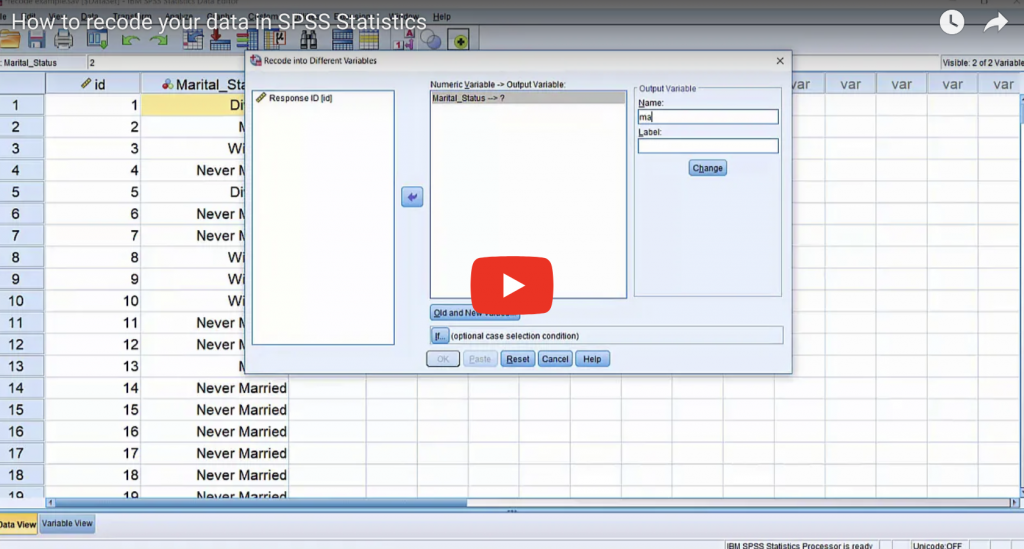
Recoding your data means changing the values of a variable so that they represent something else. Within SPSS Statistics there is more than one type of recode that can be performed.
How to recode your data in SPSS Statistics Read More »
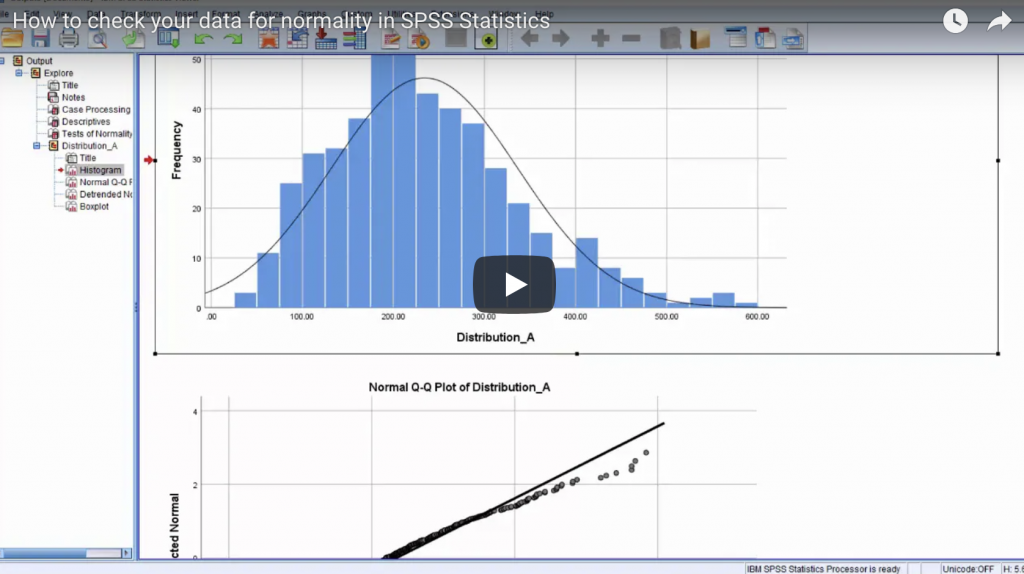
In this video Jarlath Quinn demonstrates how to use the functions within the explore command in SPSS Statistics to test for normality.
How to check your data for normality in SPSS Statistics Read More »
In this video Jarlath Quinn demonstrates how to work with date and time variables in SPSS using the SPSS date and time wizard.
How to calculate with dates in SPSS Statistics Read More »
In this video Jarlath Quinn demonstrates how to use SPSS Statistics to define data filters in order to select particular cases for analysis. This can be done either to create a temporary selection or to create a permanent new file with only a subsection of cases included within it.
How to select cases in SPSS Statistics Read More »
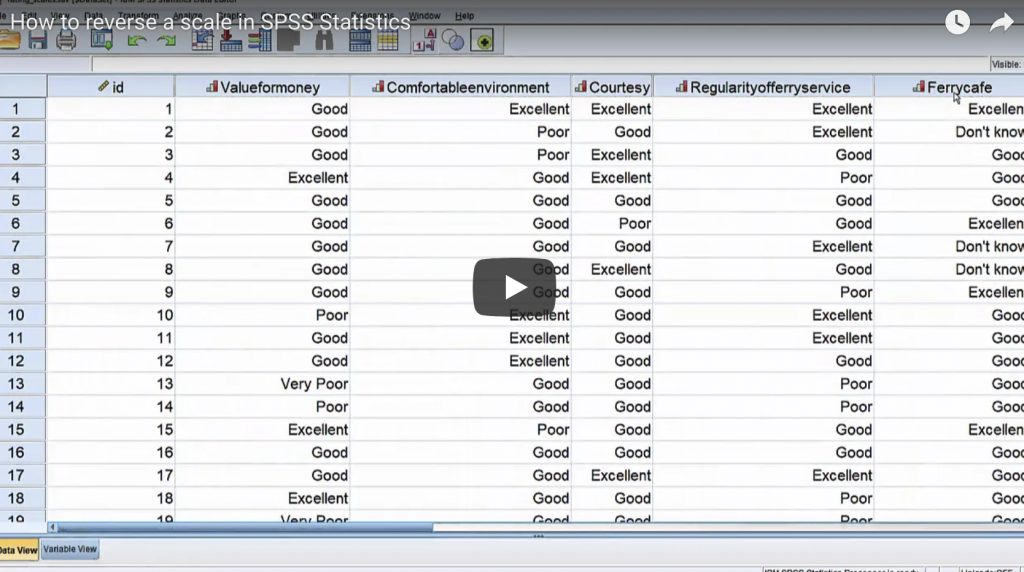
In this video Jarlath Quinn demonstrates how to reverse the values of a rating scale (such as an agreement scale or a satisfaction scale) in SPSS Statistics, so that the highest value becomes the lowest value and vice versa.
How to reverse a scale in SPSS Statistics Read More »
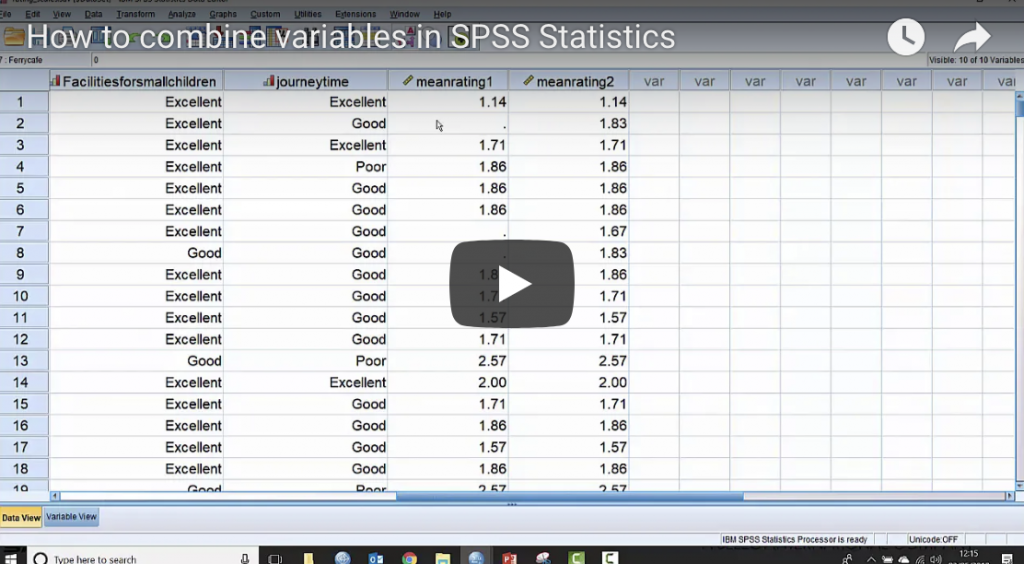
SPSS users often want to know how they can combine variables together. In this video Jarlath Quinn demonstrates how to use the compute procedure to calculate the mean of a number of variables to create one combined variable, and also how to use the count values procedure to count how many times a particular value occurs across a series of variables in order to create an overall count.
How to combine variables in SPSS Statistics Read More »

Can you start off just by talking a little bit about your background and how you came to be working
Expert insight – Nick Di Paulo, Lead Customer Researcher, Hyde Housing Group Read More »

I have been in the business of delivering software applications and solutions that have advanced and predictive analytics at their
5 key trends affecting technical training provision in predictive analytics Read More »

Could you start off just by telling us a bit about your background and how you came to be working
Expert insight – Karsten Shaw, Director of Analytics, Populus Read More »

What’s your background? How did you come to be working in analytics? I came from an accounting background and then

What’s your background? How did you come to be working in analytics? I suppose accidentally really. I studied politics at
Expert insight – Emma Brooker, Customer Insight Manager, L&Q Read More »
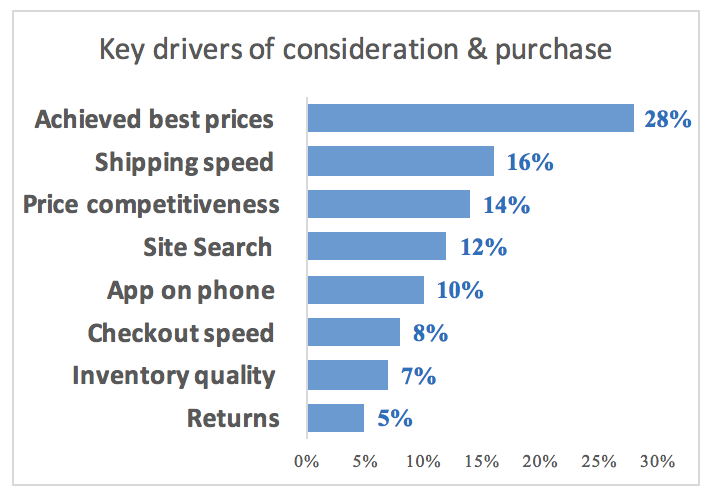
In most businesses it’s not enough to simply be measuring outcomes like customer satisfaction, sales, customer churn rates, subscription renewals,
7 things you need to know about key driver analysis (KDA) Read More »

Surveys remain one of the most popular forms of market research, and consequently we regularly work with customers on large

As it is the end of the year I’ve decided to devote this blog post to some thoughts on where
Analytics predictions for 2018 Read More »

Most companies these days are aware of the potential value that advanced analytics could offer them. Lots of people are
How to ensure advanced analytics gives you a concrete competitive advantage Read More »
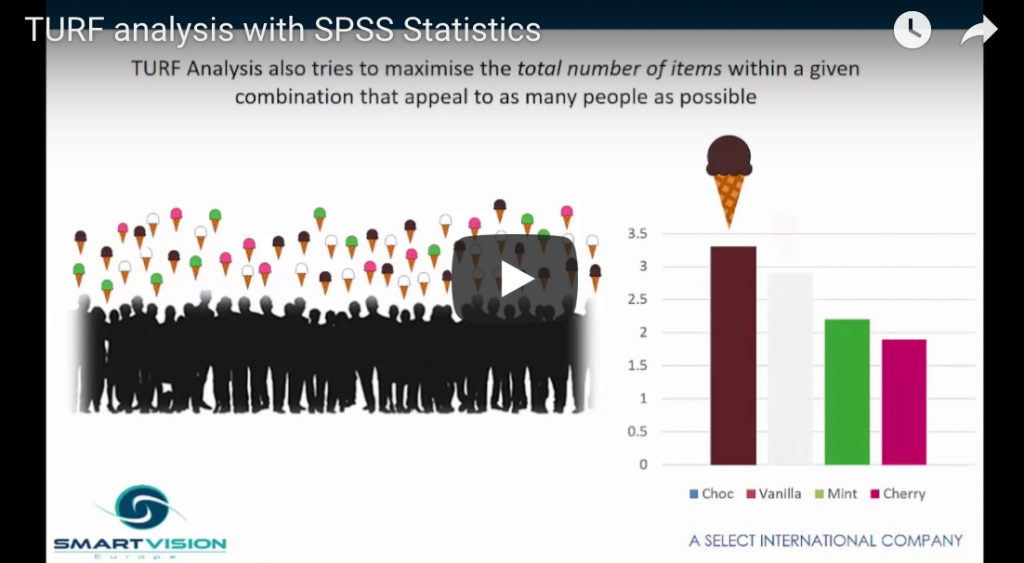
In this video Jarlath Quinn introduces the popular TURF analysis technique and demonstrates how to apply it in IBM SPSS Statistics. TURF analysis is used in many industries to find the optimal sub-group of options from a wider portfolio in order to maximise their appeal to an audience or market.
TURF analysis with SPSS Statistics Read More »
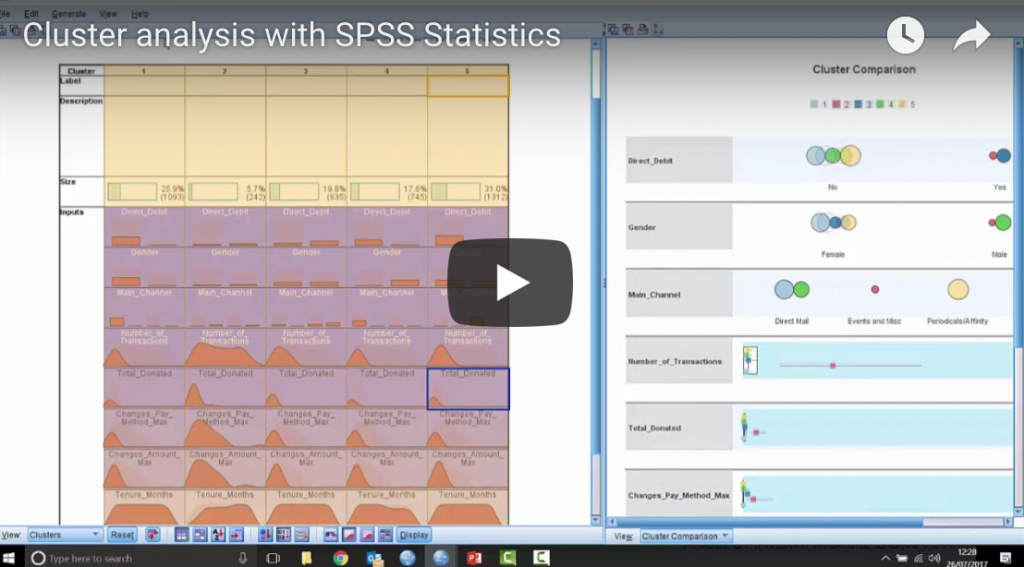
In this video Jarlath Quinn explains what cluster analysis is, how it is applied in the real world and how easy it is create your own cluster analysis models in SPSS Statistics.
Cluster Analysis with IBM SPSS Statistics Read More »
With less than a year to go until it comes into effect, organisations are really starting to get to grips
How will the GDPR affect big data analytics? Read More »
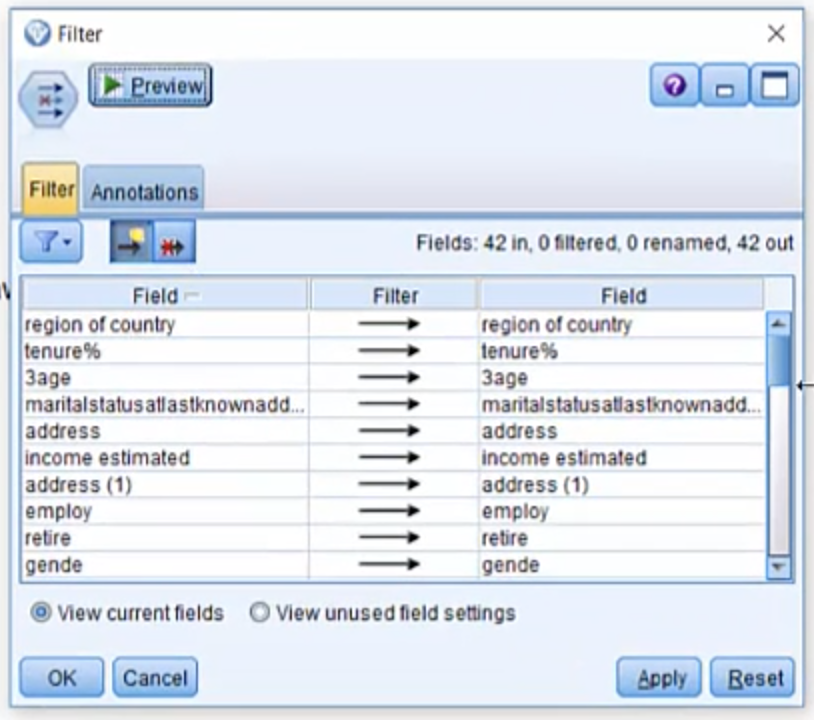
Sometimes you may have problems with your data issues not related so much to the values of the data but to the fields themselves, such as awkward field names. The filter node is a really useful tool that offers a bunch of tricks for dealing with awkward fields.
Introduction to the filter node in SPSS Modeler Read More »
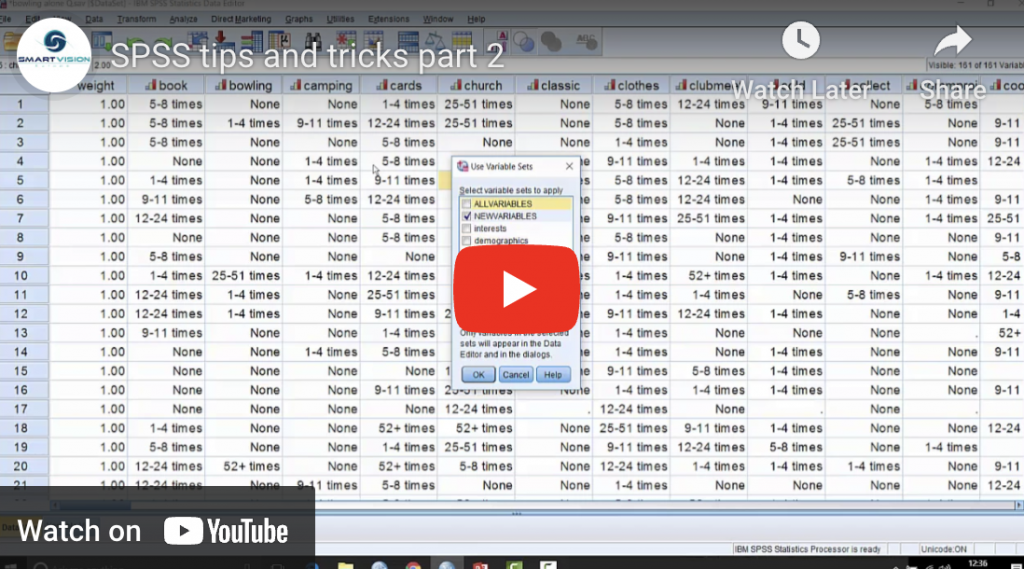
In this video we explore variable sets – a procedure in SPSS that allows you to generate subsets of variables or fields for display within dialogue boxes and in the data editor itself.
How to work with variable sets in SPSS Statistics Read More »
Used correctly, the generate menu offers analysts some substantial time saving benefits. Watch this video to learn more about how you can use the generate menu effectively.
Introduction to the generate menu in SPSS Modeler Read More »

Many of our clients regularly hire new analysts and we’re often involved in discussions about what the core skills are
Thinking of hiring a data analyst? What skills should they have? Read More »
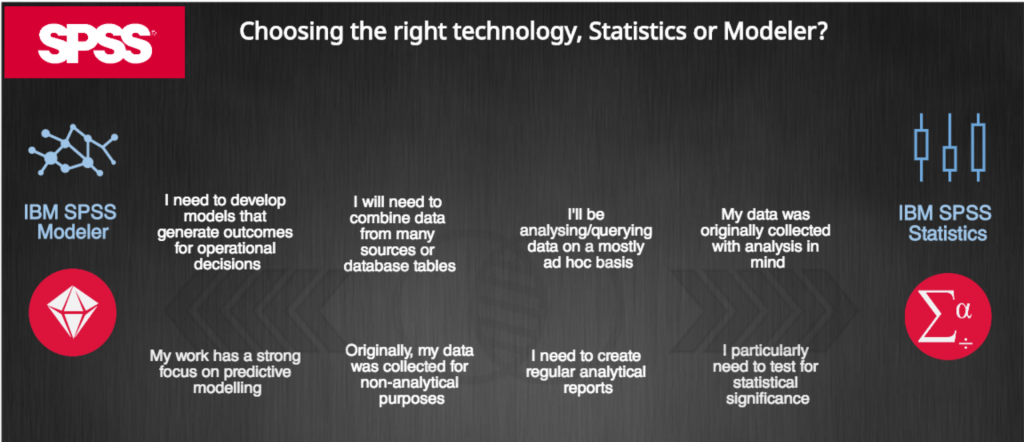
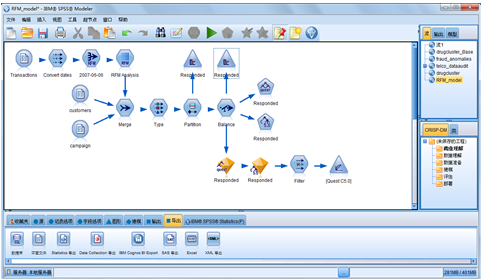
We often talk to people who are unsure whether they need SPSS Statistics or whether SPSS Modeler might be more
Do I need SPSS Statistics or Modeler? How to choose the right product for your needs Read More »
SPSS enables quite a high level of customisation so you can set up the software in a way that enables you to be a lot more productive, however many people are unaware of just how powerful these customisation options are. In this video we explore the options edit menu.
How to change the defaults in SPSS Statistics Read More »
The data audit node is a powerful tool you can use to help understand the shape and structure of your data before your analysis begins. You can also make some decisions here regarding how you might want to clean up your data, for example by dealing with missing values or extremes and outliers.
Introduction to the data audit node in SPSS Modeler Read More »

Over the past two years I’ve noticed a steady stream of articles in the mainstream press and business journals centred
Fear and loathing in machine learning Read More »
The real world, whether it be the physical world, for example machines, or the natural world, for example human and
I’ve blogged several times now about different aspects of data science. A conversation I’ve been having more and more frequently
Which data science tools should you learn? Read More »
