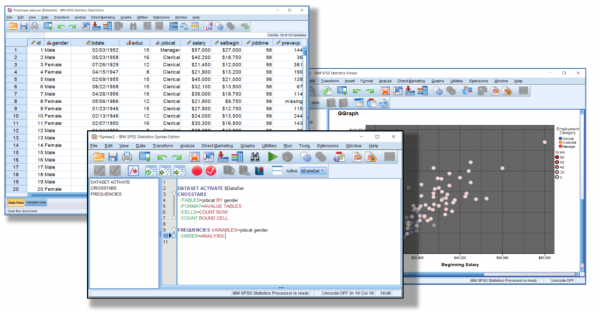
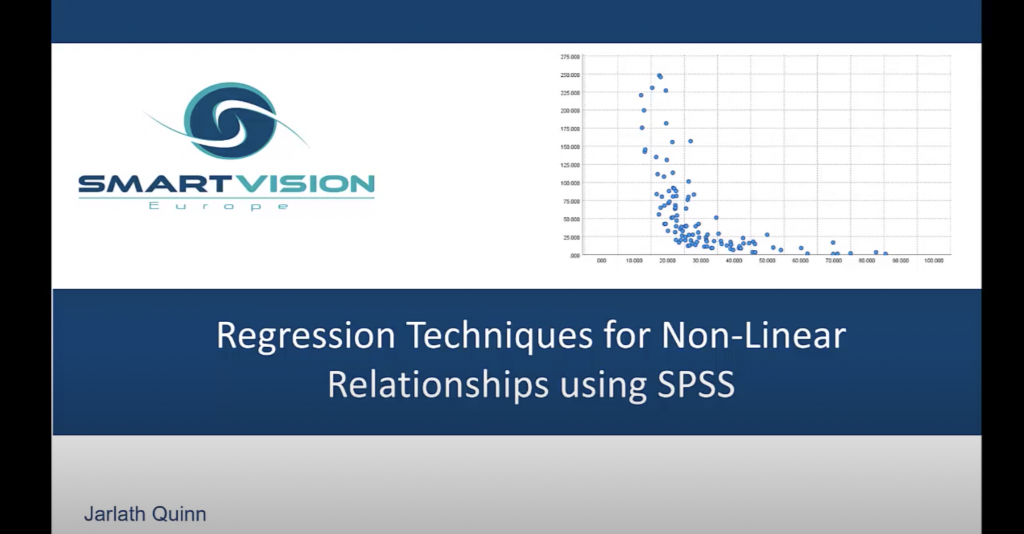
How to interpret significance tests
What do so called ‘significance tests’ signify? Watch this on demand webinar to find out more.
Forecasting with time series analysis has been used in both the public and commercial sectors for decades. Watch this webinar to see how it could work for your organisation.
Download this ebook to learn how DataRobot and Intel® work together so that enterprises can quickly train large datasets and build production-ready machine learning models, and more.
Our report, The Business Value of MLOps by Thomas Davenport, highlights some of the most impactful benefits of MLOps tools and processes for different types of organisations. It is based on interviews with MLOps user companies and several MLOps experts.
In this ebook, you’ll see how business leaders are leveraging AI to decrease machine downtime, improve demand forecasts, and accelerate supply chain logistics. You’ll discover that AI isn’t an intimidating technology, but rather a practical tool to grow your business and change the world.
Our ebook, AI in Customer Analytics: Tapping Your Data for Success, takes a deep dive into the many ways that companies can put their AI to work for better customer success.
In our 10 Keys to AI Success in 2021 ebook, we show how organisations are overcoming hurdles and realising the enormous rewards that AI can bring to any organisation.
Download your free copy of our Customer Analytics for Dummies eBook. It will help you with understanding customer analytics, acquiring and segmenting valuable customers, recognising customer lifetime value, enhancing customer loyalty and retention, extracting value out of social media.
IBM SPSS is one of the most versatile analytics tools available on the market today. In this A-Z guide we outline just some of the many features that make it great.
In this book, you will discover types of machine learning techniques, models, and algorithms that can help achieve results for your company. This information helps both business and technical leaders learn how to apply machine learning to anticipate and predict the future.
Predictive analytics projects fail all the time. In this book, Jarlath Quinn draws on his experiences and those of his colleagues to explore precisely what drives success or failure in predictive analytics projects. When it works, why does it work and what can be done to manage the risk of failure?
If you’re familiar with programming languages such as Python or R then you can use them to extend the functionality of SPSS, automate more processes and make your jobs more stable and robust. This white paper tells you how to develop such IBM SPSS Statistics extension commands.
This free white paper presents some points you should consider if you use, or plan to use, a spreadsheet to perform statistical analysis. It also describes an alternative that in many cases will be more suitable.
This white paper discusses survey research by breaking it up into a seven step process — and clearly detailing how you maximize your efforts every step of the way. At each stage, it also shows how IBM SPSS predictive analytics technology can improve your results.
This paper considers the role service quality plays in predicting customer satisfaction and customer behavioral intentions in two types of service industries: lodging and retail banking.
This white paper presents a number of typical, real world examples of predictive analytics and shows how it can be used to address key business issues, with the aim of illustrating practical ways in which analytical capabilities can be deployed in a range of different organisations.
The purpose of this paper is to demonstrate the benefits of using R and SPSS together, rather than simply trying to go it alone with R. With SPSS software, R users get access to superior data management, a point-and-click interface, presentation-quality output and improved scalability.
Predictive analytics uses advanced algorithms to analyze donor data and deliver a 360-degree view of individual donors. Read this white paper to learn how to gain insight into the needs, preferences and behaviors of donors.
This white paper is designed to explain predictive analytics, followed by a look at how it can impact activity at the highest levels of institutional management. We provide examples of how predictive analytics has been used at a variety of institutions, including a review of its potential pitfalls and benefits.
This white paper provides an overview of geospatial analytics and why it is important to organisations seeking deeper insights about their business, customers or constituents.
Using the CRISP-DM framework can help make this process much simpler and give you a clear structure and set of criteria that you can use for your assessment. We have prepared a short guide explaining how best to use CRISP DM as a framework for evaluating data mining tools.
This whitepaper explores the practical applications of predictive analytics within retail and how it can be used to deliver a smarter shopping experience.
This seminar provides an introduction to predictive analytics that’s specifically tailored to the needs of B2B organisations.
This webinar provides an overview of the different ways in which digital marketers can use SPSS Modeler to acquire new customers and to retain those that they already have. The webinar gives an introduction to core analytics applications and the benefits of using SPSS Modeler.
IBM SPSS Statistics is an incredibly powerful analytical tool. This event provides an overview of the range of modules available in SPSS and what each one does in order to help those relatively new to SPSS to understand its potential and identify new ways in which they could be using it.
The new RX nodes in IBM SPSS Modeler extend the Visual Data Science approach of SPSS Modeler itself to Regular Expression handling.
In this webinar we demonstrate how you can use the power of REGEX to perform the most typical text handling tasks, without the pain of learning yet another programming language.
If you’re currently using spreadsheet tools such as Excel for your analytics then this webinar will give you an insight into how dedicated analytics tools like IBM SPSS can help you to take your analytics to the next level.
This webinar provides an introduction to how charities can use predictive analytics and data mining in order to identify their most profitable donors and maximise donor value.
This webinar shows you how to create professional analytical reports, use an extensive portfolio of professional and innovative visualizations, and benefit from of data-manipulation procedures.
You will also learn to use a dedicated, flexible reporting application to consolidate and display multiple outputs and share reports across the organisation including via web portals.
Creating custom procedures can dramatically increase your productivity in SPSS and the good news. This webinar shows how you don’t need to be an expert user or know how to ‘code’ in order achieve this.
View this webinar to see how to use Watson Studio Desktop’s powerful visual analytics to explore your data, clean and prepare data files in readiness for predictive analytics. Learn how to build and assess predictive models and to test the accuracy of your predictions and apply them to new data.
In this webinar we will draw on the hard-won experiences of industry professionals to examine precisely what drives success or failure in predictive analytics. Using the CRISP-DM framework, the session will focus on the practical aspects of planning for successful outcomes.
Using IBM SPSS Modeler, this webinar will demonstrate methods to improve the accuracy of predictive models. It should be noted that most of these approaches are not unique to the SPSS Modeler application and may have relevance for people working with alternative software packages.
It can cost up to six times more to get a new customer than it does to keep one that you already have. This webinar shows you how you can use predictive analytics techniques and the data that you already hold to improve customer retention rates in your organisation.
Free text data is often thought to be difficult or time-consuming to analyse, so much so that in many organisations this kind of data is collected but then not really effectively analysed at all. This session is designed to show you how easy it is to analyse this kind of data and get real value from the research you’re doing.
Decision trees are used extensively and widely within predictive analytics. In this webinar we discuss how decision trees can be used to build profiles of customers, employees and clients; find key behavioural segments and generate predictive models. You’ll learn how to generate decision trees in SPSS and how to interpret your results.
When you’re in the thick of the analysis phase of a data mining or predictive analytics project it’s easy to forget about how you’re actually going to deploy your model, but deployment is really critical to the success of any project. In this webinar we examine different methods for effectively deploying the result of your modelling within your organisation.
This webinar show you how you can use SPSS Modeler to harness the power of any unstructured data you have in your organisation, from customer feedback forms through to social media posts.
This webinar provides a brief introduction to the core functionality of IBM SPSS Statistics – ideal for anyone who is considering investing in SPSS Statistics or has already got it but isn’t sure that they’re making the most of it. This webinar helps you get up and running quickly and shows you some of the power of SPSS.
This webinar gives an introduction to some of the ways in which SPSS Modeler can help organisations to make sense of their customer survey and feedback data, including free text fields and other unstructured data.
This webinar presents different applications of predictive analytics for database marketers. The aim is to help organisations understand how they can use the information in their marketing database to more effectively acquire new customers as well as to retain those they already have and maximise their value to the organisation.
This webinar provides an introduction to the CRISP-DM methodology and discussed how best to manage each stage of the process in order to maximise your chances of success.
Around 20% of students do not complete their studies, making retention a big concern for all universities and HEIs. Watch this webinar to understand which student characteristics and behaviours most influence the chances of them remaining engaged with their course.
This webinar gives a brief introduction to predictive analytics, how it differs from business intelligence, and suggests ways in which organisations can get started with predictive analytics quickly and easily.
What’s new in SPSS version 27? Correlations output now includes the ability to show only the lower triangle of values, suppress the diagonal coefficients and calculate confidence intervals. One-Sample, Independent-Samples and Paired-SamplesProportionTests have been added to the base system. McDonald’sOmega has been added to the suite of reliability analysis procedures. RestorePoint functionality that saves data …
What functionality has been added to SPSS over the last few versions? Read More »
IBM is about to release the latest version of SPSS Statistics. Here’s a summary of some of the new enhancements that existing users can look forward to. Meta-analysis Meta-analysis is a well-established analytical approach that combines the results from a range of studies with a view to estimating the effect size of the treatment in question. …
Correlation is a term that we employ in everyday speech to denote things that appear to have a mutual relationship. In the world of analytics correlations are specific values that are calculated in order quantify the relationships between variables. This kind of analysis is powerful because it allows us measure the association between factors such as …
The chi-squared test is used to examine differences with between fields with different categories and to determine whether those differences are significant.
The real world, whether it be the physical world, for example machines, or the natural world, for example human and animal behaviour, is very complex with many factors, some unknown, determining their behaviour and responses to interventions. Even if every contributory factor to a phenomenon is known, it is unrealistic to expect that the unique …
What is the difference between the various types of statistical models? Read More »
When you’re conducting any kind of statistical analysis, it’s vital that you select the correct tests to perform, given the characteristics of your data and the analytics outcomes that you’re hoping for. If you don’t choose the right tests then the results you generate can be meaningless and this can lead to business decisions being …