Identifying unusual cases: anomaly detection with SPSS
In this video, we show how to spot anomalous records using the Identify Unusual Cases procedure in SPSS Statistics.
Identifying unusual cases: anomaly detection with SPSS Read More »
In this video, we show how to spot anomalous records using the Identify Unusual Cases procedure in SPSS Statistics.
Identifying unusual cases: anomaly detection with SPSS Read More »
In this video, we show you how to weight data in SPSS so that samples better reflect the population from
How can I weight data in SPSS Statistics? Read More »
The fundamentals of Poisson Regression.
Poisson regression with SPSS part 1 Read More »
Understanding SPSS output from the Poisson Regression procedure.
Poisson regression with SPSS part 2 Read More »
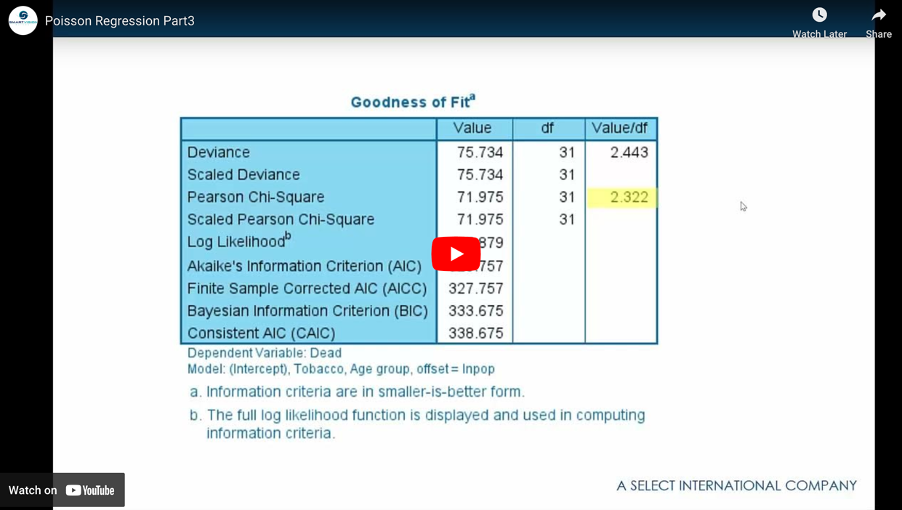
Dealing with overdispersion in Poisson Regression
Poisson regression with SPSS part 3 Read More »
In this video we introduce the procedure and show how to configure it in IBM SPSS Statistics. In this initial run, we go through each of the output tables and explain how to interpret them and assess if the statistical assumptions have been met before finally evaluating the level of accuracy in the predictions.
Part one – Introduction to discriminant analysis Read More »
In Part 2, we take a deeper dive and look at optional approaches such as changing the prior probabilities, introducing bootstrapping and using Fisher discriminant coefficients to create predictive formulae.
Part two – Additional discriminant analysis options Read More »

Part 1 – An overview of SurveyMonkey’s export options
Part 1 – An overview of SurveyMonkey’s export options Read More »
Part 2 – Exporting data with the ‘Actual answer text’ option
Part 2 – Exporting data with the ‘Actual answer text’ option Read More »
Part 3 – Exporting data with the ‘Numerical values’ option
Part 3 – Exporting data with the ‘Numerical values’ option Read More »
Part 4 – Exporting as data as an SPSS .sav file
Part 4 – Exporting as data as an SPSS .sav file Read More »
SPSS Syntax has long been exploited by expert analysts due to its flexibility, power and ease of learning. Syntax vastly increases users’ productivity by making it easier to automate commonly used procedures.
The basics of SPSS syntax Read More »
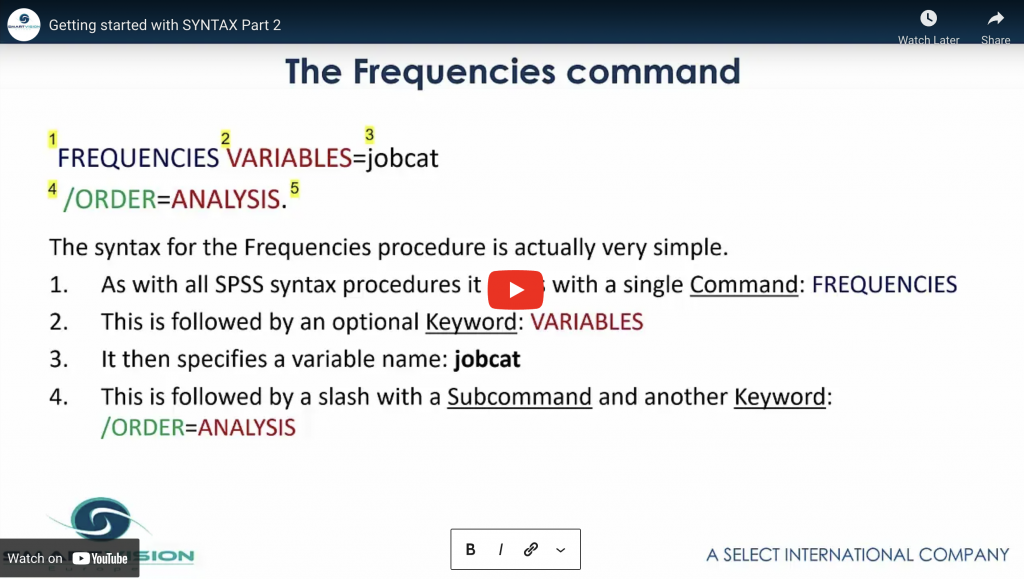
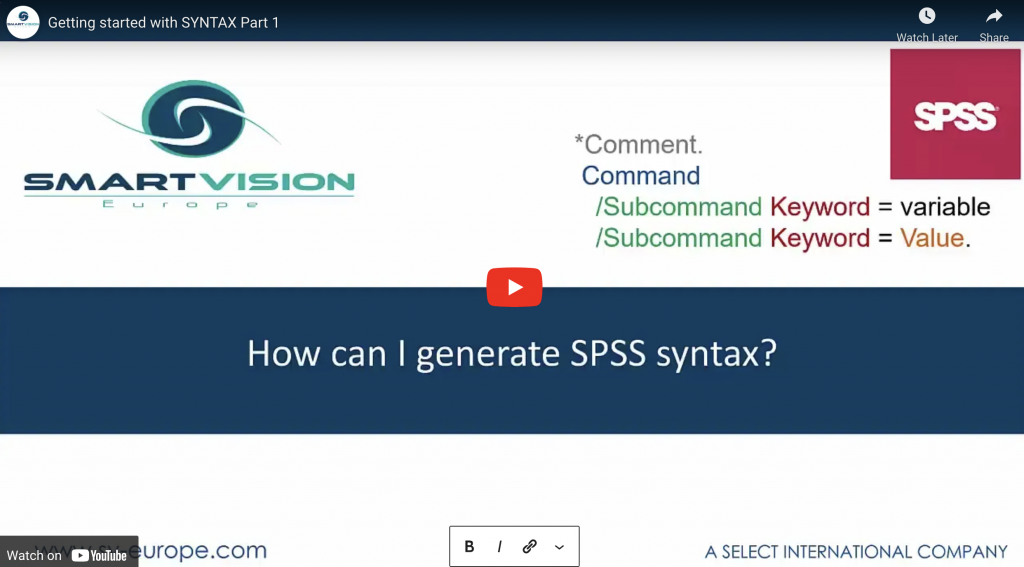
Explains what the DATASET ACTIVATE command does and explores the grammatical structure of syntax procedures.
Exploring the grammatical structure of syntax procedures Read More »
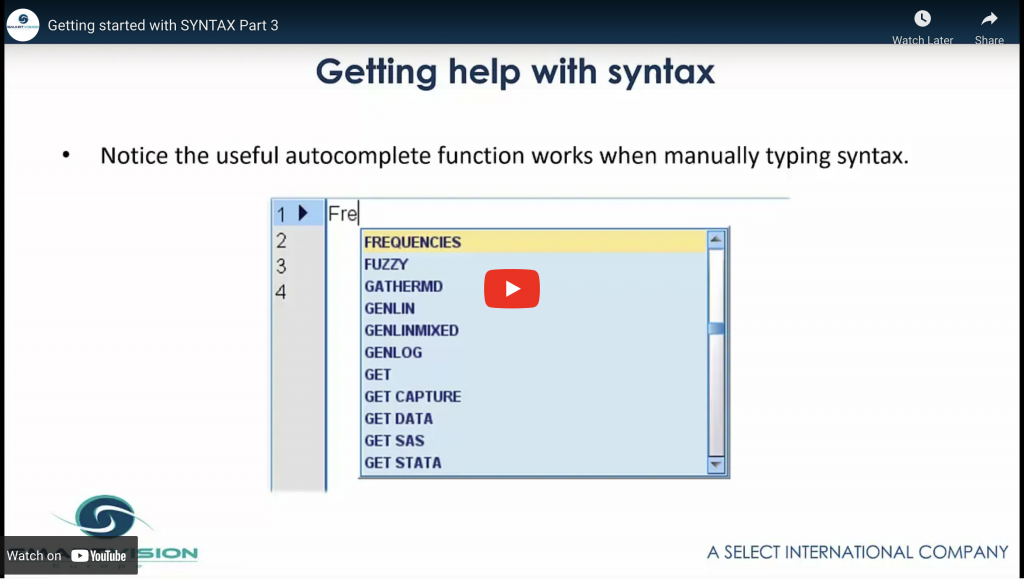
Shows how to add comments to syntax without creating errors and explains how to use syntax Help resources to run different procedures.
Getting help with SPSS syntax Read More »
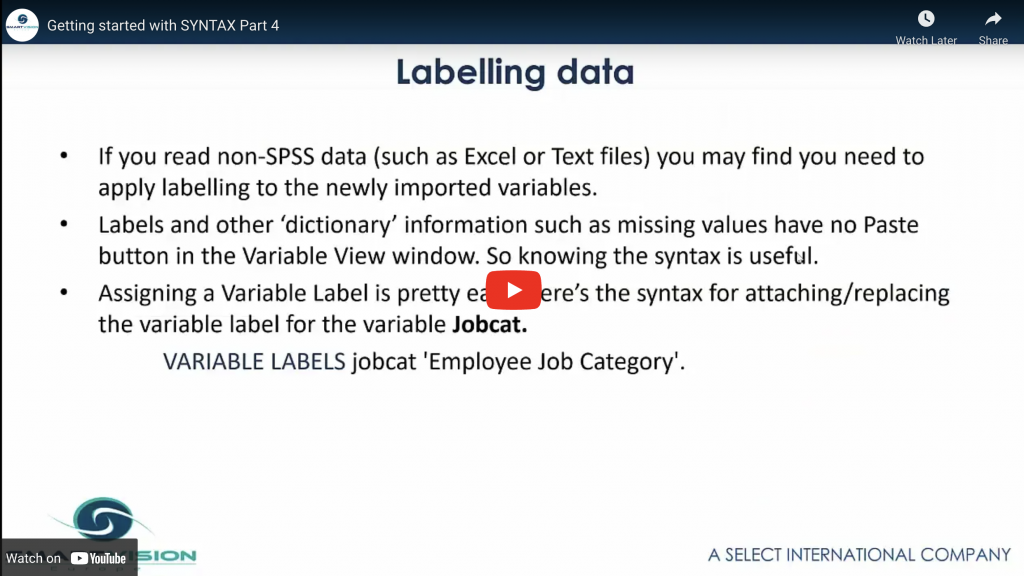
Shows how read different data files with syntax, how to create and add labels to variables and how to recode data using syntax.
Useful syntax procedures Read More »
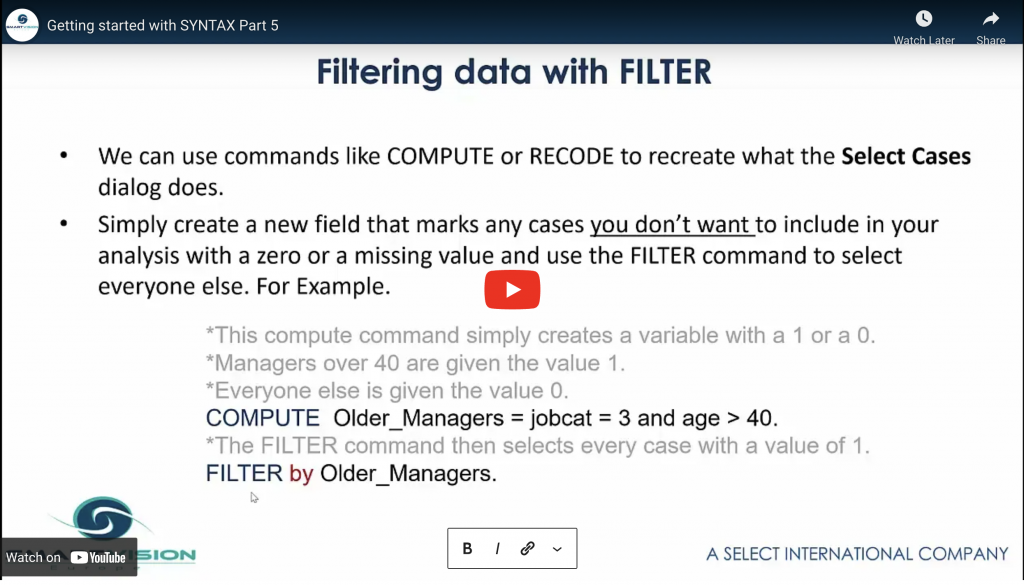
Explores different methods for filtering data and introduces the TEMPORARY command.
Different methods for filtering data using syntax Read More »
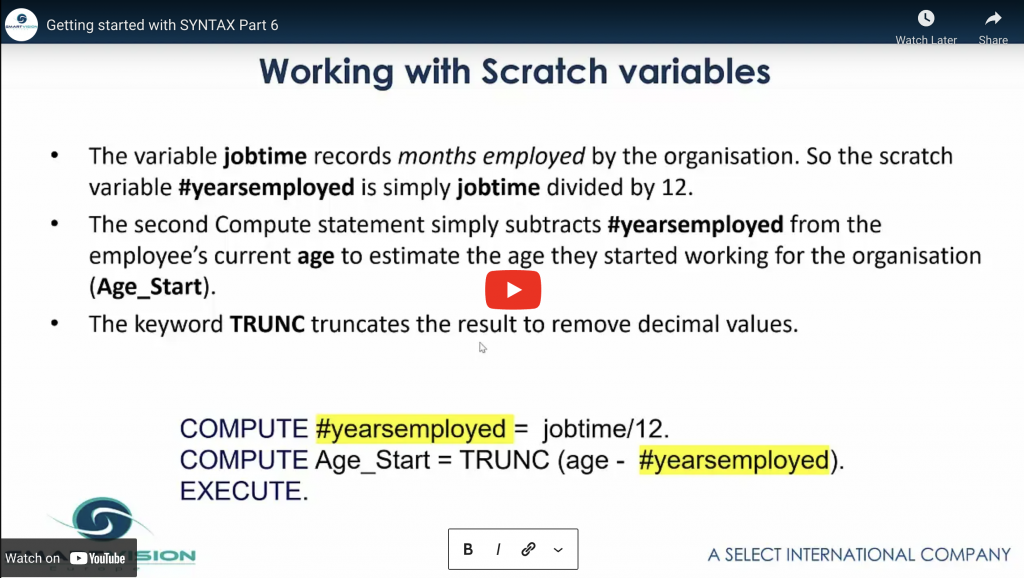
Introduces the TO and ALL commands, working with temporary variables, renaming and deleting variables, reading or saving data with the DROP and KEEP subcommands and modifying output with syntax.
Working with variables in SPSS syntax Read More »
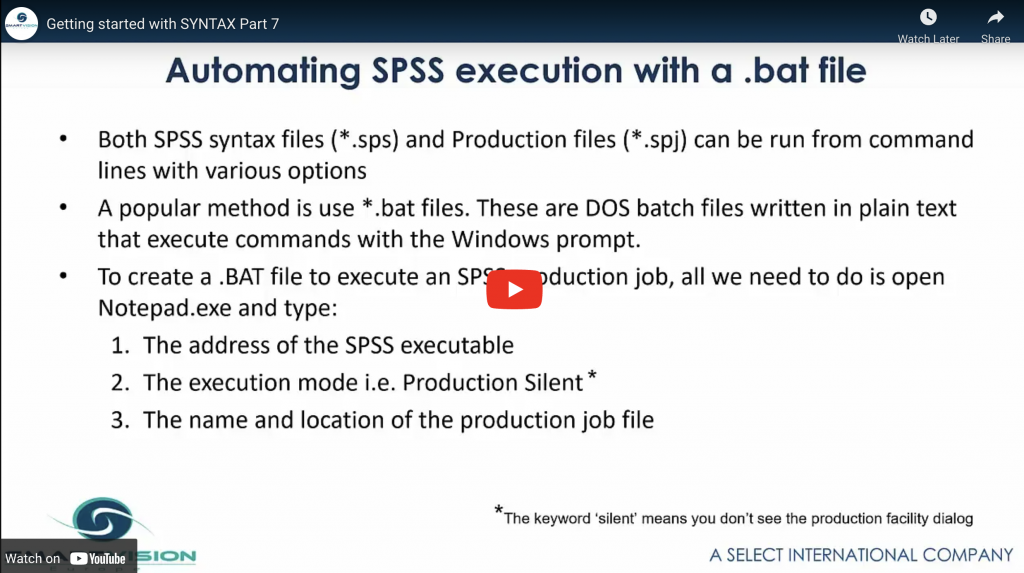
Shows how to automate syntax jobs with the Production facility and creating batch scheduled jobs for timed execution.
Automating and scheduling jobs with SPSS syntax Read More »

In this two-part video series Jarlath Quinn explores how to work with the Neural Networks module in SPSS Statistics (watch part
Introduction to the Neural Network module in SPSS Statistics – part two Read More »
In this two-part video series Jarlath Quinn explores how to work with the Neural Networks module in SPSS Statistics. Watch part
Introduction to the Neural Networks module in SPSS Statistics – part one Read More »
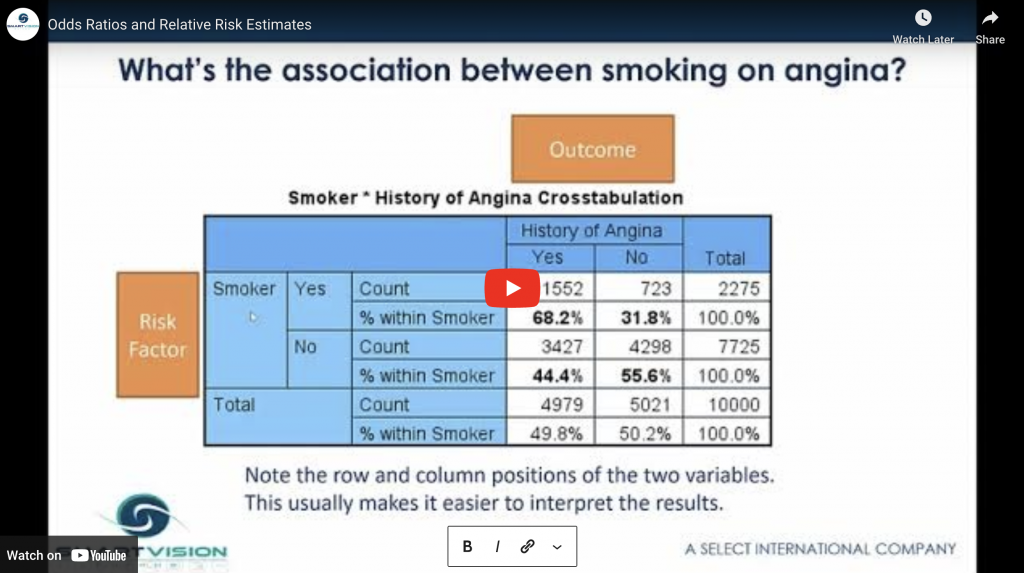
In this video, Jarlath Quinn explains how odds and relative risks are calculated and how you can code and arrange your variables so that interpretation is as straightforward as possible.
Making sense of odds ratios and relative risk estimates in SPSS Statistics Read More »
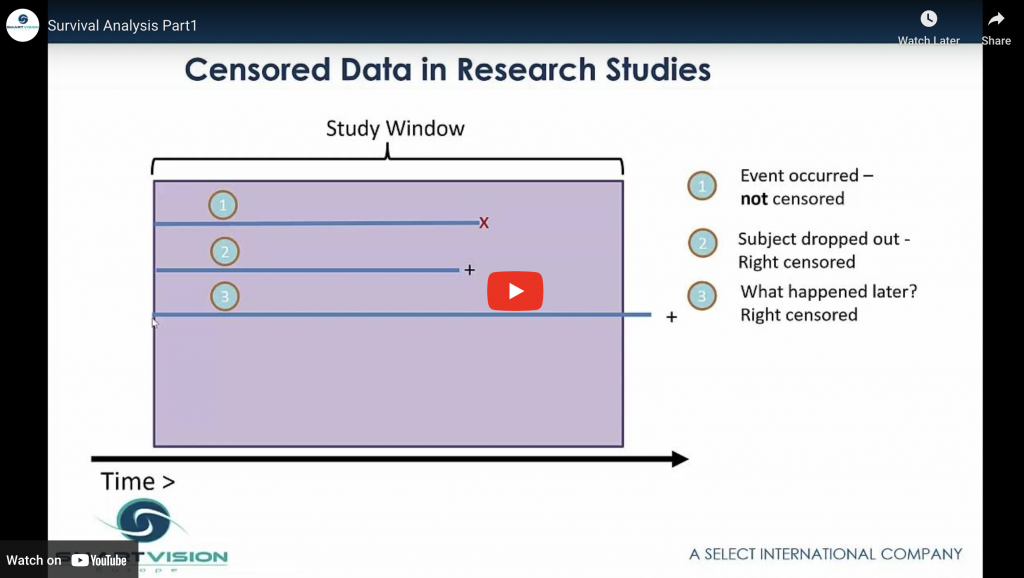
This video looks at the key concepts that underpin survival analysis such as time-to-event data, censored cases and the different survival analysis procedures available in IBM SPSS Statistics.
Introducing survival analysis Read More »
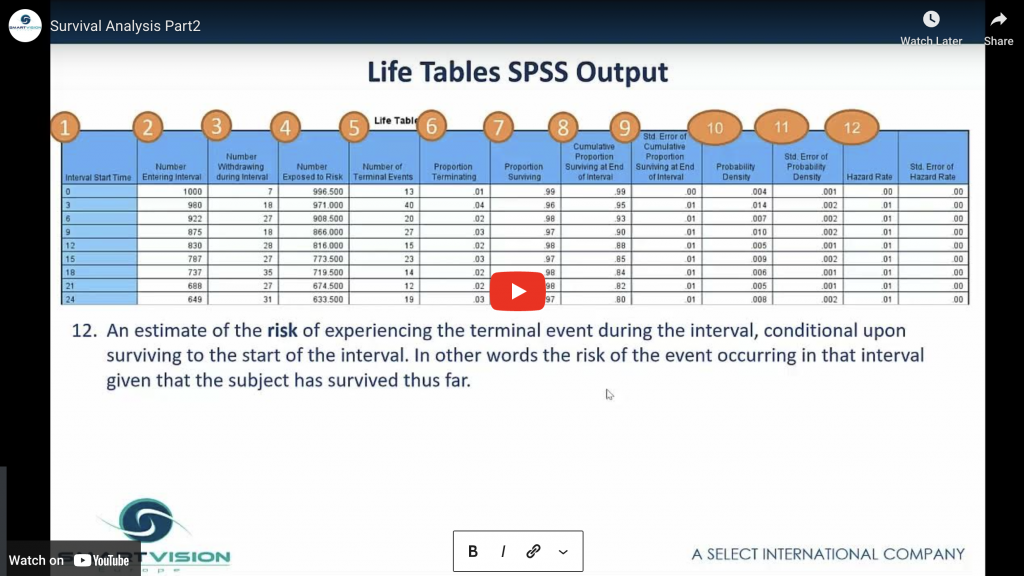
This video explores the Life Tables procedure and introduces many of the key concepts of survival analysis such as cumulative survival, hazard rates and survival curves
Exploring the life tables procedure Read More »
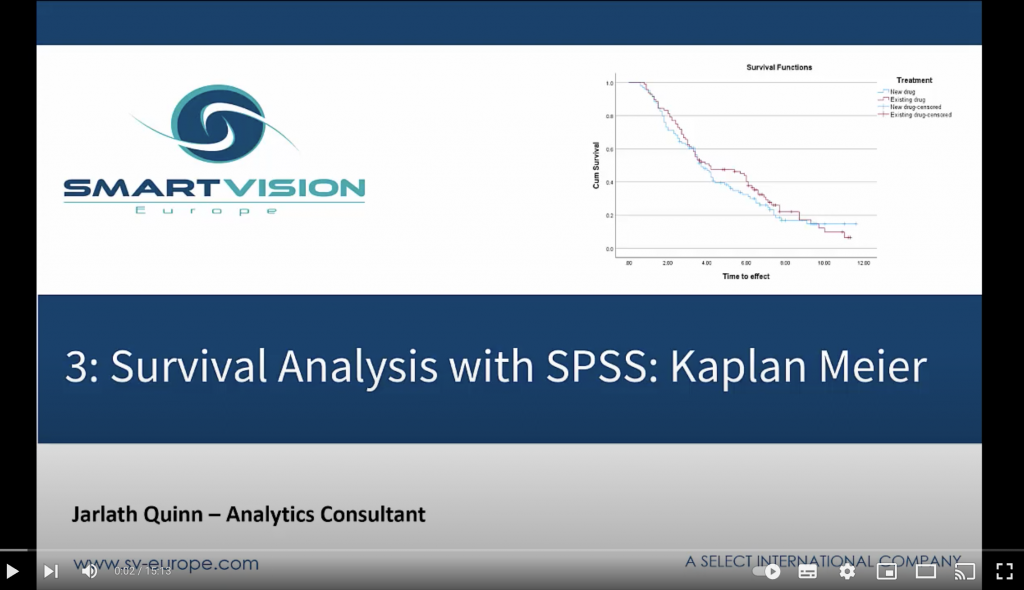
This video looks at the non-parametric Kaplan Meier procedure including tests of equality of survival distributions and the difference between survival and hazard functions.
The Kaplan Meier procedure Read More »
This video introduces the Cox Regression method and explains the proportional hazards model. Shows how to interpret the output from Cox Regression using a simple model with a single predictor.
Introduction to Cox regression Read More »
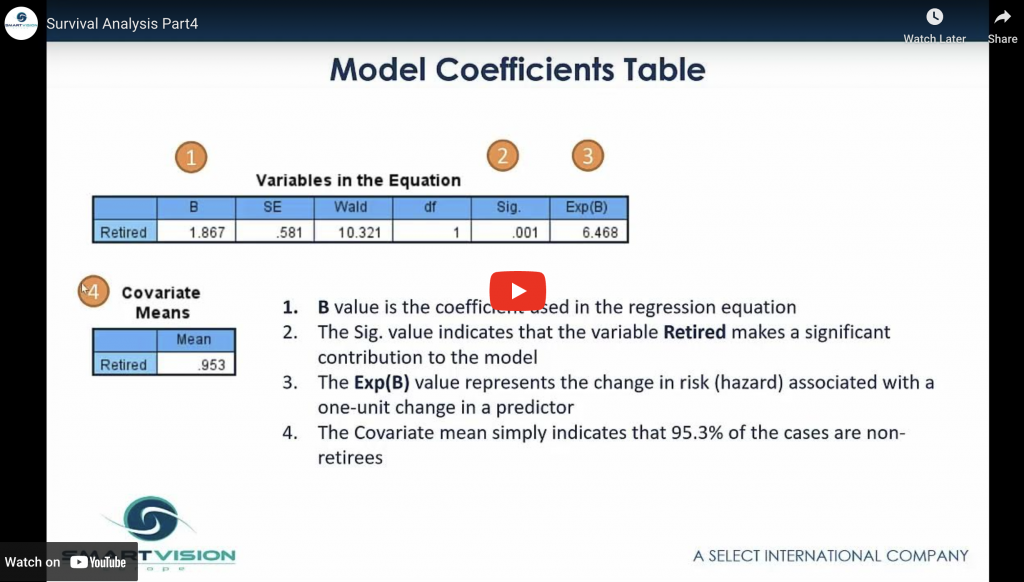
This video shows how to create a more complex Cox Regression model. Also introduces the Cox Regression with Time Dependent Covariates procedure.
Cox regression with multiple variables Read More »
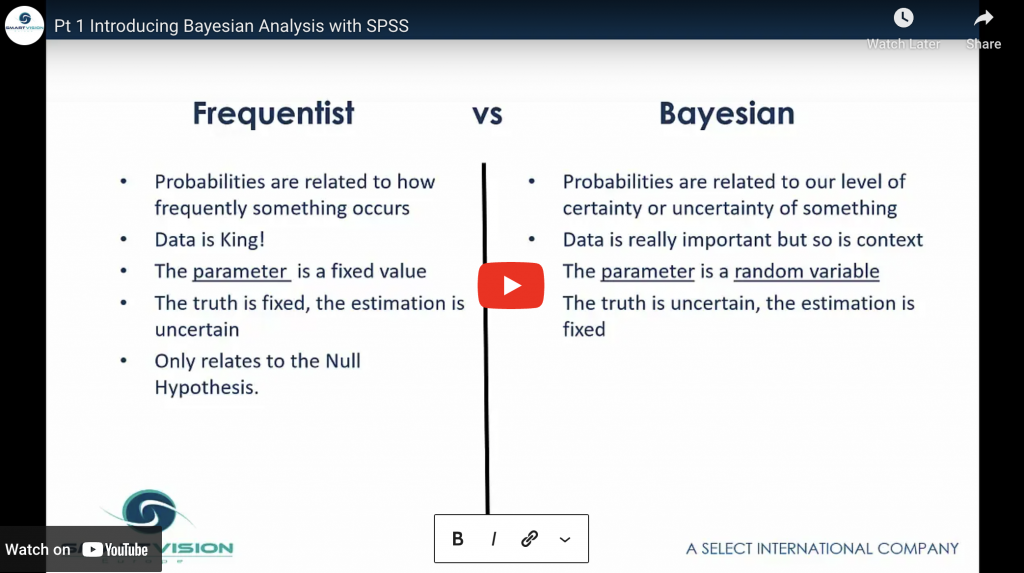
Explores the historical and theoretical context of the classical ‘Frequentist’ statistical approach and its Bayesian counterpart.
Introducing Bayesian analysis with SPSS Read More »
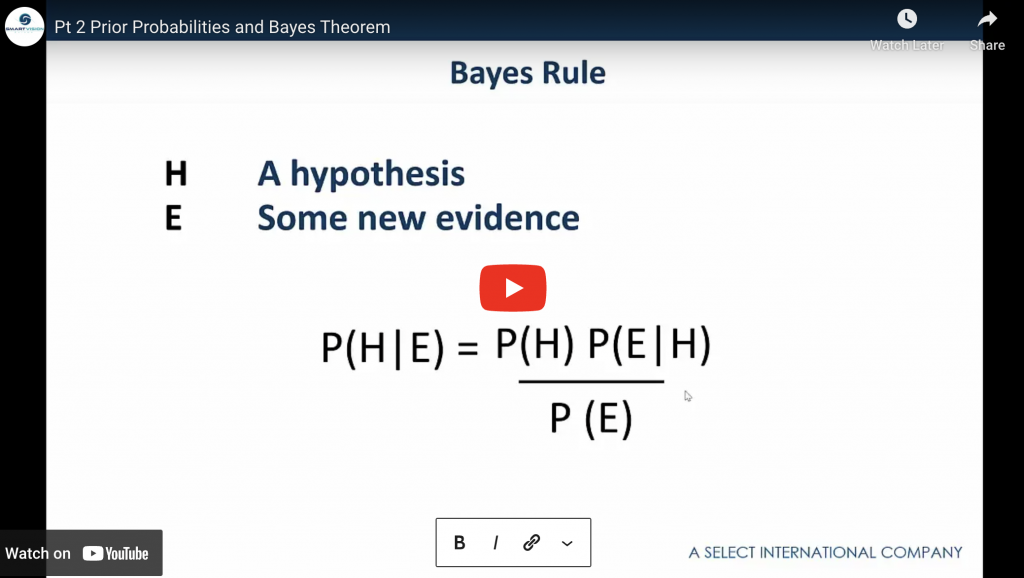
Introduces the concept of Prior Probabilities and how these are utilised in Bayes Theorem.
Prior probabilities and Bayes’ theorem Read More »
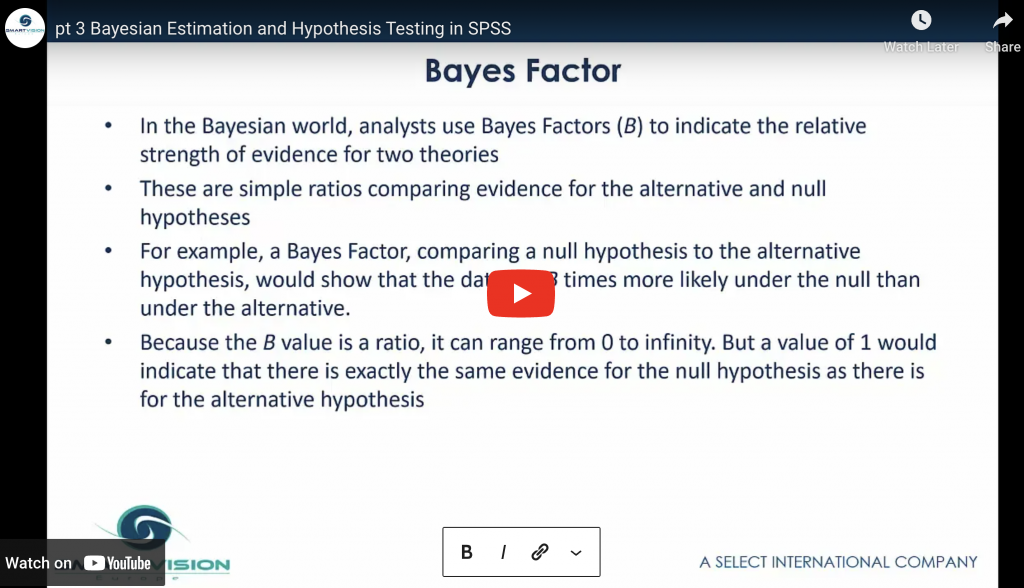
Introduces credible intervals and the use of Bayes Factor as an alternative to P values.
Bayesian Estimation and Hypothesis Testing in SPSS Read More »
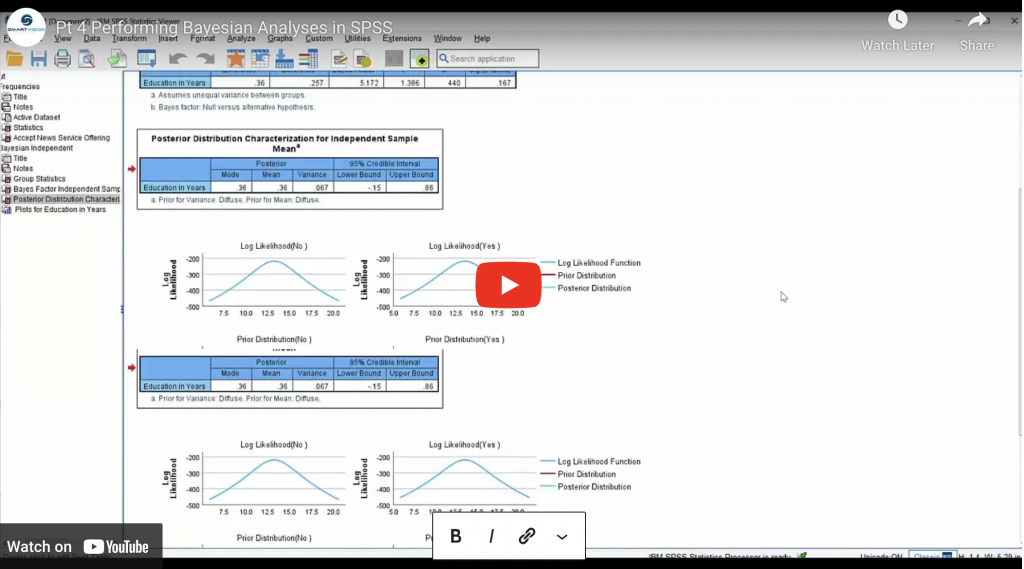
Shows how to perform a Bayesian Analysis in SPSS Statistics and how to interpret the output.
Performing Bayesian Analyses in SPSS Read More »
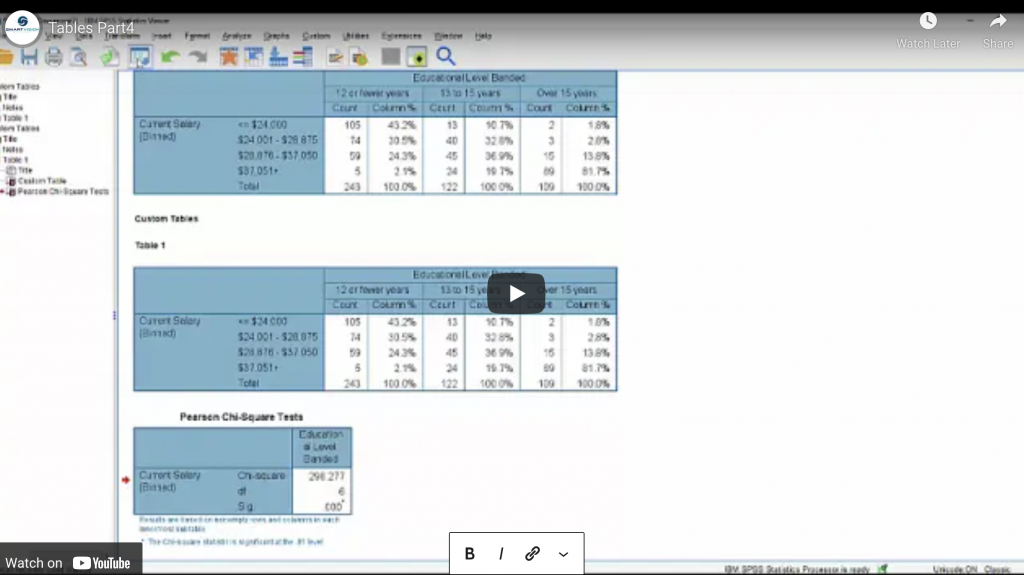
A video guide to performing tests of significance in the SPSS Custom Tables module.
Performing tests of significance Read More »
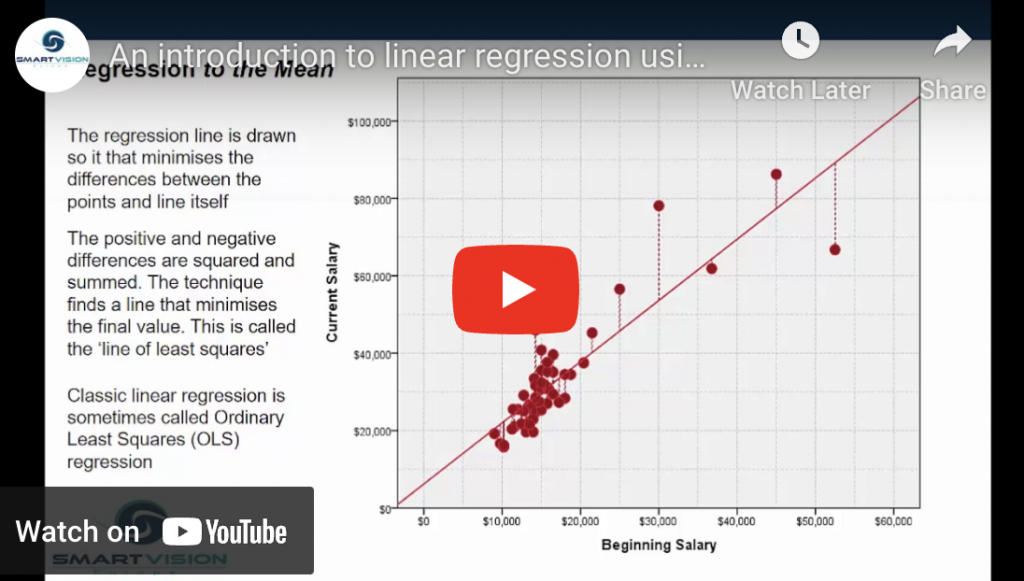
In classical statistics, linear regression is regarded as the ‘gateway to predictive modelling’. For decades students have been taught about regression from theory to practice simply because it still one of the most versatile and simple ways to understand and predict the effect of key factors on critical outcomes.
Introduction to linear regression Read More »
In this video Jarlath Quinn shows how you can move beyond simple linear regression to model curvilinear relationships using techniques such as variable transformations and quadratic regression before finally exploring how log-log regression can be used to model price elasticity of demand.
Modelling non-linear relationships with SPSS Read More »
The video explores moderation analysis, which enables analysts to identify interaction effects that alter the relationship between a dependent and independent variable.
An introduction to moderation analysis Read More »
This video explores mediation analysis – an analytical approach used to test if a third factor could represent the underlying cause of a relationship between an independent and dependent variable.
An introduction to mediation analysis Read More »
In these videos Jarlath Quinn introduces the concept of Structural Equation Modelling with SPSS AMOS. In the first video Jarlath uses the example of creating a simple linear model to illustrate the functionality in the AMOS interface.
Introduction to structural equation modelling with SPSS Amos – part one Read More »

In these videos Jarlath Quinn introduces the concept of Structural Equation Modelling with SPSS AMOS. In the second video Jarlath shows how to perform a basic Confirmatory Factor Analysis in AMOS.
Introduction to structural equation modelling with SPSS Amos – part two Read More »
Watch the other videos in this series
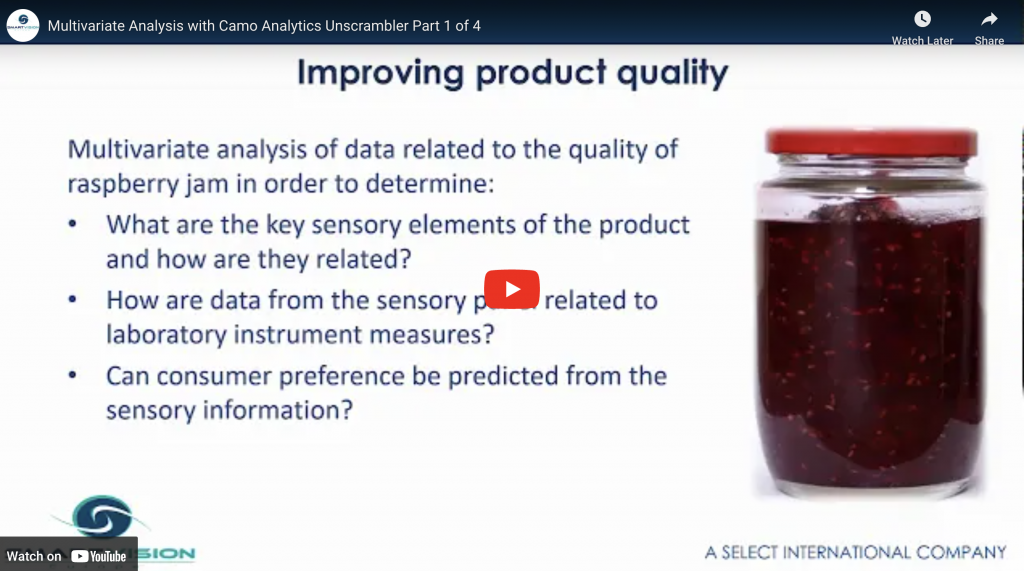
Multivariate analysis with Camo Analytics Unscrambler part one Read More »

Watch the rest of the videos in this series
Multivariate analytics with Camo Analytics Unscrambler part two Read More »

Watch the other videos in this series
Multivariate analysis with Camo Analytics Unscrambler part three Read More »

Watch the rest of the videos in this series
Multivariate analysis with Camo Analytics Unscrambler part four Read More »
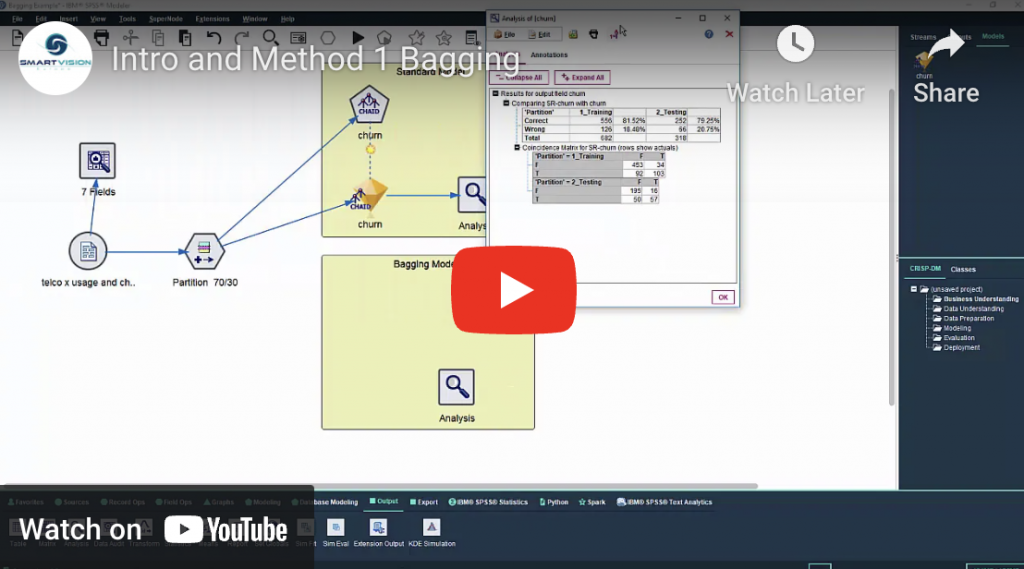
Bootstrap aggregation, also called bagging, is a random ensemble method designed to increase the stability and accuracy of models. It involves creating a series of models from the same training data set by randomly sampling with replacement the data.
6 secrets of building better models part one: bootstrap aggregation Read More »
Boosting is another ensemble model-building method that was designed to help develop strong classification models from weak classifiers. Boosting methods focus on error (or misclassifications) that occur in prediction.
6 secrets of building better models part two: boosting Read More »
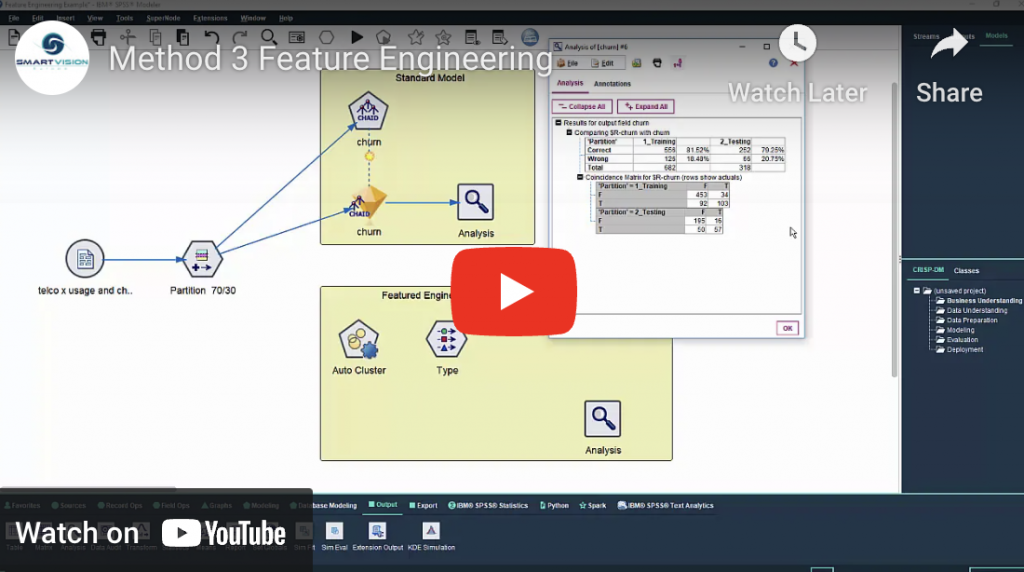
Feature Engineering is really just a fancy term for creating new data. Very often we can help an algorithm build better models by preparing the input data in a way that allows it to detect a clearer signal in the often noisy data. In machine learning variables are often referred to as ‘features’, so feature engineering refers to the transformation of variables or the creation of new ones.
6 secrets of building better models part three: feature engineering Read More »
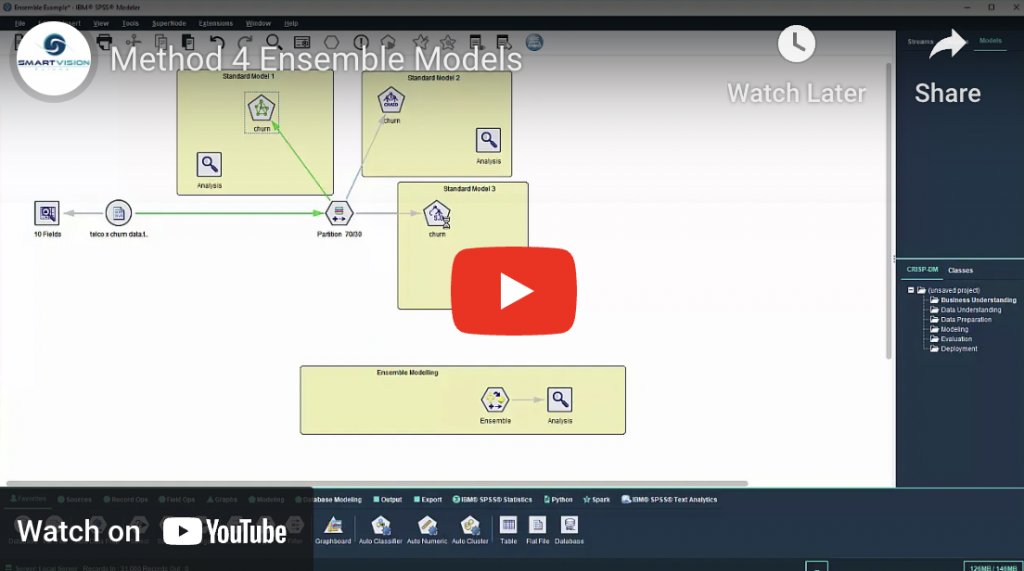
Ensemble modelling refers to the practice of combining the predictions of separate models on the old principle that “two heads are better than one”. Ensemble methods can be particularly effective when combining models that have been created using completely different algorithms.
6 secrets of building better models part four: ensemble modelling Read More »