IBM have released a new update to SPSS v27. Interestingly, this is a ‘dot’ release that contains a number of useful functional improvements rather than the usual bug fixes or third-party compatibility enhancements.
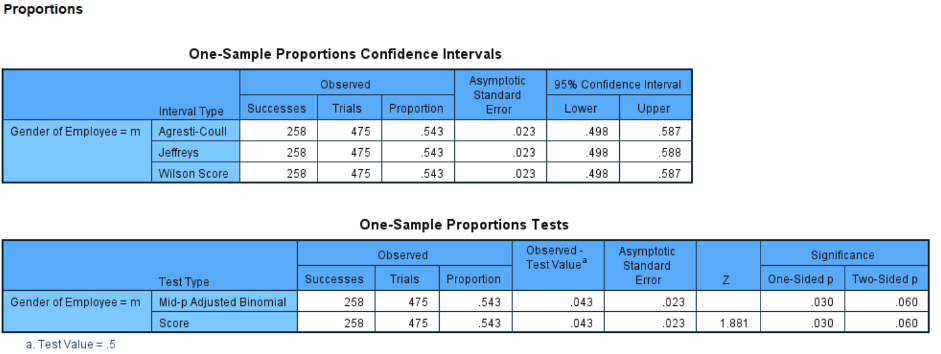
The new procedures include three additional statistical tests for comparing differences in proportions. These procedures were introduced as syntax only commands in v27 and they are useful if, for example, one wished to check if a sample failed to adequately reflect certain proportionate splits known to exist in a population (such as the proportion of males and females).
In the latest release, these ‘z test’ commands have been given their own dialogs and are available for one sample, paired samples and independent samples situations. Curiously, the developers have chosen to place these proportion tests under the ‘Compare Means’ sub-menu, the logic being that a proportion is in fact a mean of a binary variable. Although I’m not sure many users would naturally associate proportional differences in category frequencies with means.
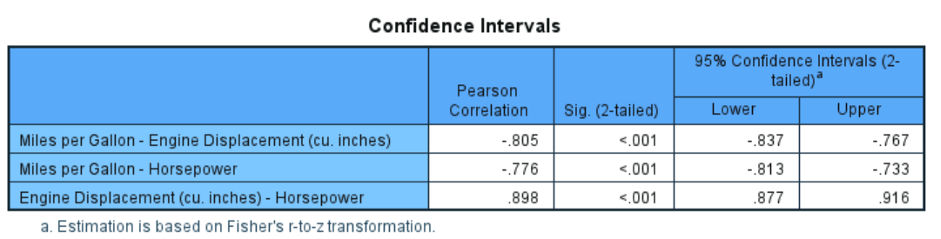
In v27 many users were pleased to see (finally) some welcome changes to the Bivariate Correlations procedure. As such, users were able to request that the output displays only the lower triangle of a correlation matrix and suppress the redundant diagonal values. Version 27.0.1.0 however, goes one better and now includes the option to add confidence intervals to correlation values.
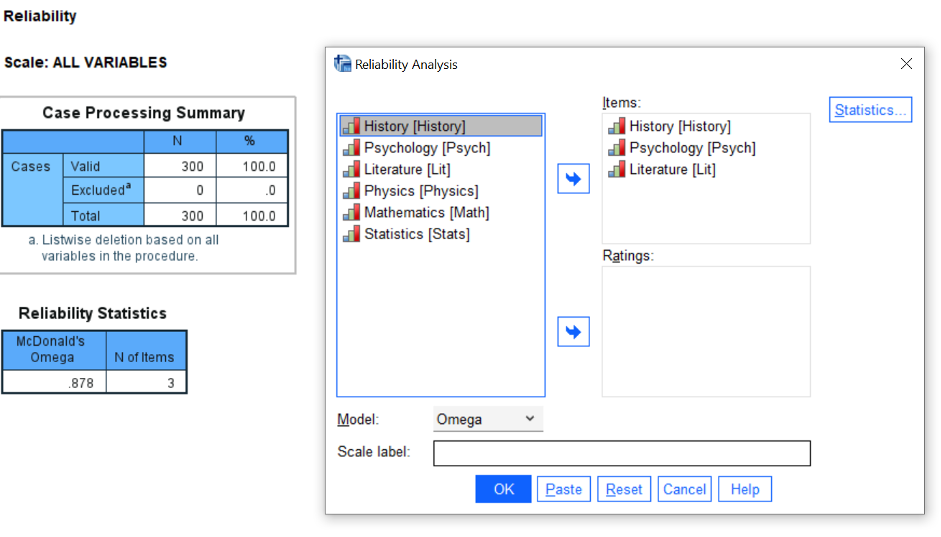
For users interested in Reliability analysis, where analysts run tests to make sure that scales consistently reflect the subject matter they are designed to measure, this latest release includes the McDonald’s Omega statistic. The Omega reliability measure is often regarded as more optimal than the classic Cronbach’s Alpha statistic, but until recently the computational requirements meant that users had to rely on procedures such as confirmatory factor analysis to calculate it. Thanks to a new method of computation, this can now be calculated within SPSS Statistics.
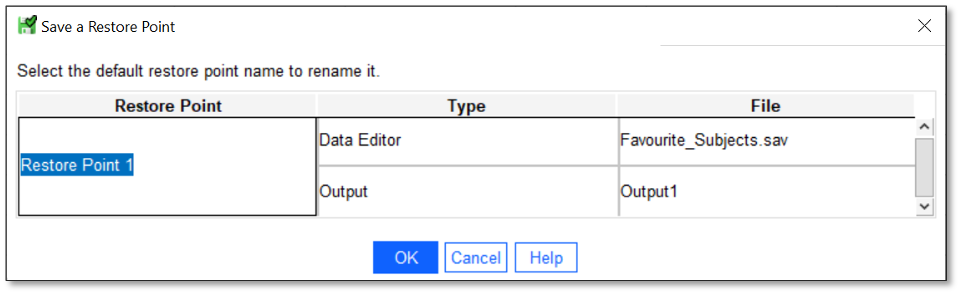
The version 27 release also introduced an important functional enhancement in the form of an auto-recovery feature which recovers unsaved files and content in instances where the application quits unexpectedly. This functionality has been extended in v27.0.1.0 to allow people to save a point in time in their analysis. Users can then revert back to this earlier restore point if needed later, without compromising the current analytical progress.
Lastly, the latest release has cleaned up some of the functionality with regard to working with table and chart editors. Previously, the table editor used a single toolbar which was often ‘cut-off’ by the frame window making it awkward to edit tables. The developers have taken the decision to split this into two separate toolbars to make it easier for users see these functions.
Also, improvements to the chart editor make it easier to move titles and legend objects within the editor frame. Finally, both editors now include a useful reset toolbar button that allows users to switch the display back to its default appearance.
