In June of this year, IBM released the latest version of SPSS Statistics. Version 27 introduces several additional analysis procedures as well as new system enhancements. In this report we take a tour of some of the most valuable improvements that have been made.
There’s a video of this tour here as well.
Bootstrapping and Data Preparation are now standard functionality
One of the biggest changes in this release is that the Bootstrapping and Data Preparation modules are now included with SPSS Statistics base, meaning that they are now part of the standard functionality of the package.
Bootstrapping is a powerful way to estimate statistical values and ensure analytical models are reliable and accurate. It can be used to enhance a number of procedures including descriptives, means, crosstabs, correlations, regression. It works by repeatedly resampling the data file to derive more robust estimates of parameters values such as means, standard deviations and model coefficients.
Data Preparation is a veritable Swiss army knife of functions that allow users to identify and fix data errors or potential problems in their datasets. Using a combination of basic checks, validation rules or anomaly detection algorithms, Data Preparation generates new variables and output reports that pinpoint problematic cases or unusual records. It includes the ability to find duplicate records, perform optimal binning and prepare the data for multivariate modelling by changing date and time fields, excluding low quality fields, handling outliers and missing values, rescaling interval fields and filtering out poorly performing predictor variables.
New analytical functionality
Version 27 now includes two key enhancements to statistical analysis. The first enhancement takes the form of new effect size calculations. Analysts are aware that in statistics it’s possible to reject a null hypothesis using a probability test even when the difference or relationship between variables or groups is very small. For this reason, statisticians often use techniques such as effect size to measure the magnitude of the observed relationship as well. One of the most common effect size statistics used for comparing pairs of mean values is Cohen’s d. For the independent samples T-test, Cohen’s d is determined by calculating the mean difference between the two groups, and then dividing the result by the pooled standard deviation (basically the weighted average of the two standard deviations). Generally speaking, Cohen’s d point estimates of around 0.2 are regarded as small effects, values around 0.5 as medium-sized effects and those above 0.8 as large effects.
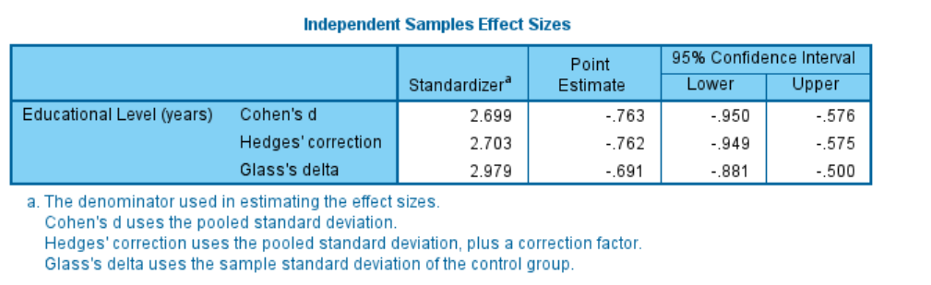
Figure 1 – New effect size calculations for an independent samples T-test. Cohen’s d point estimate of -0.763 shows a reasonably strong effect in the difference between two sample means
The second analytical enhancement is the introduction of power analysis to SPSS Statistics. Power analysis plays a key role in the planning and design of research studies. Statistical tests are used to look for evidence that you can reject the null hypothesis and conclude that there is an actual effect or relationship in the population. However, with any statistical test, there is always a possibility that the procedure will indicate there is a difference or effect when in reality one does not exist. Statistical Power calculates the probability that your data and analysis are sufficiently robust to detect the relationship in the first place. It is generally accepted that the power value should be 0.8 or greater. In other words, you should have at least an 80% or greater of finding a “statistically significant” difference when there is one. For this reason, Power analysis is often used to calculate factors like required sample size prior to the data being collected.
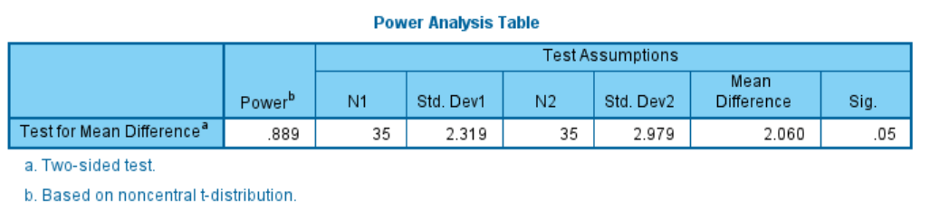
Figure 2 – New power analysis output for an independent samples T-test showing a statistical power of 0.889 for a test with a significance threshold of 0.05.
A further cosmetic change is the ability to change the display of results from the bivariate correlations procedure. Using the new option, only the correlation matrix table’s lower triangle is presented in the output and the diagonal values can be suppressed.
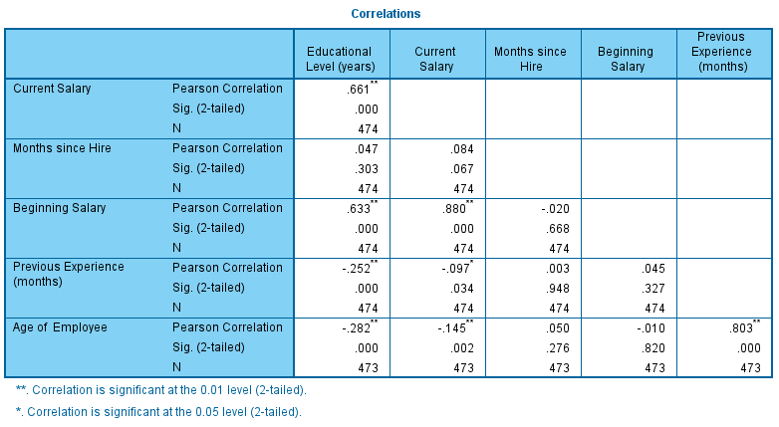
Figure 3 – A correlation matrix with only the lower triangle of results displayed and the diagonal values suppressed
Charting enhancements
The Chart Builder dialog in SPSS now includes the ability to create bubble plots. Bubble plots allow scatterplots to vary the display of data points according to the levels of an additional variable. For example, in figure 4 we can see the circles in the chart are larger for older individuals and smaller for younger people.
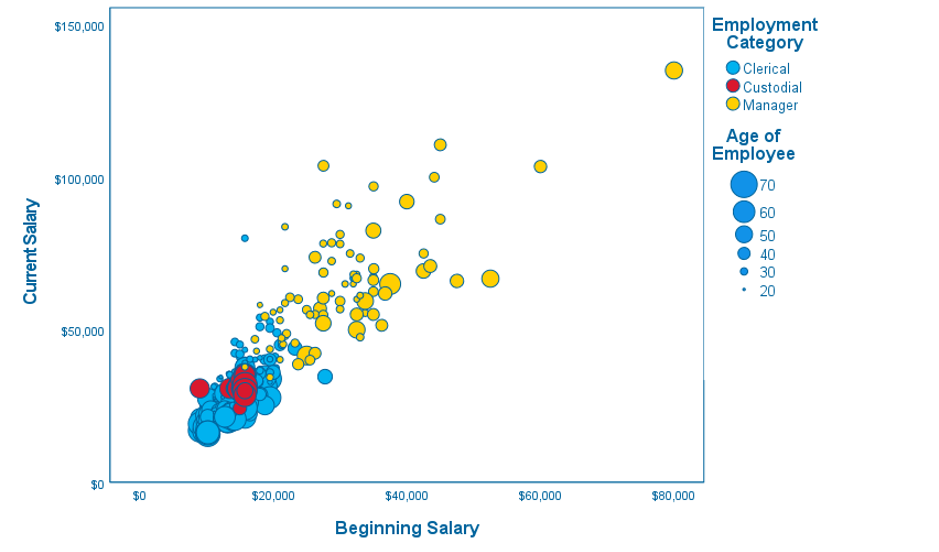
Figure 4 – The new bubble plot option for scatter plots in the Chart Builder
Another change is the ability to request that charts are formatted using one of seven pre-built chart templates within the Chart Builder dialog.
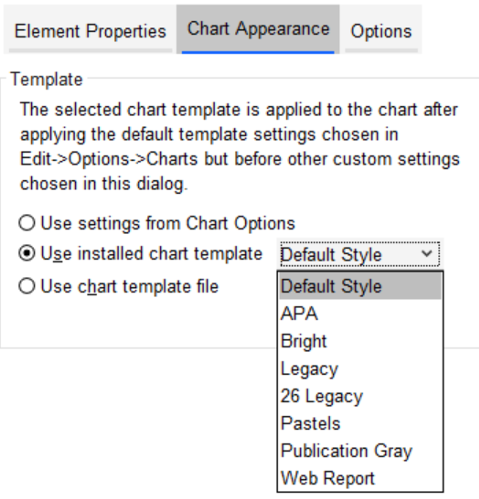
Figure 5 – The new chart template menu within the Chart Builder dialog
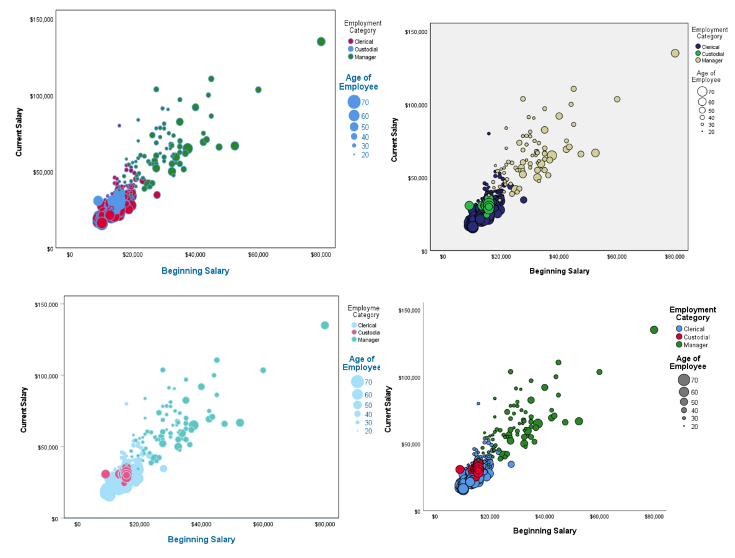
Figure 6 – Scatterplot formatted by a selection of the new pre-built chart templates
IBM have also added the ability to export graphical output in high resolution formats. When the ‘None (Graphics only)’ option is selected as the document type in the Export Output dialog, the default file type is now set to Production Ready Postscript (*.eps), which is a high resolution image format.
System enhancements
A valuable new function for all users of SPSS Statistics is the addition of an automatic recovery feature. Auto-Recovery is designed to recover unsaved files and content in instances where the application quits unexpectedly. You can choose to enable/disable the automatic recovery feature (the feature is enabled by default), select a time interval (in minutes) between saving files, and view or change the auto-recovery file location. Upon relaunching SPSS Statistics after an unexpected exit, the user is presented with an IBM SPSS Statistics error report, which allows them to enter information about the session prior to the unexpected exit. After leaving the exit report, they are presented with the Auto-Recovery dialog, which provides options for recovering prior session data or deleting the saved session data.
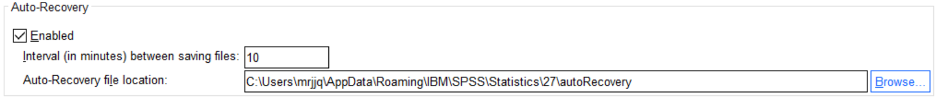
Figure 7 – Options to enable or alter the Auto-Recovery function
A further key change to SPSS Statistics is that the search facility has been updated to provide results that include menu dialogs, help topics, case studies and syntax reference.
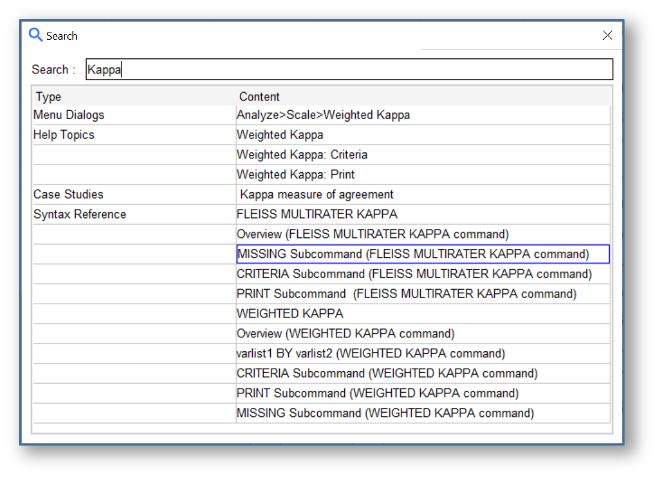
Figure 8 – The updated search facility showing results from multiple sources within the package
Other improvements
In version 27 there are some further changes to the privacy settings. The Options dialog now includes a Privacy tab that enables users to prevent the application from sharing error reports and usage/performance data with IBM. Conversely, the Help menu now provides an Issue Reporter dialog. This dialog enables users to enter information regarding any issues they may encounter when working with the product to alert IBM to possible defects or notable performance problems.
Finally, the ability to apply APA (American Psychological Association) style table settings has been added to the Cell Display dialog in Crosstabs and the main dialog in Frequencies. The setting produces output tables that adhere to APA style guidelines.
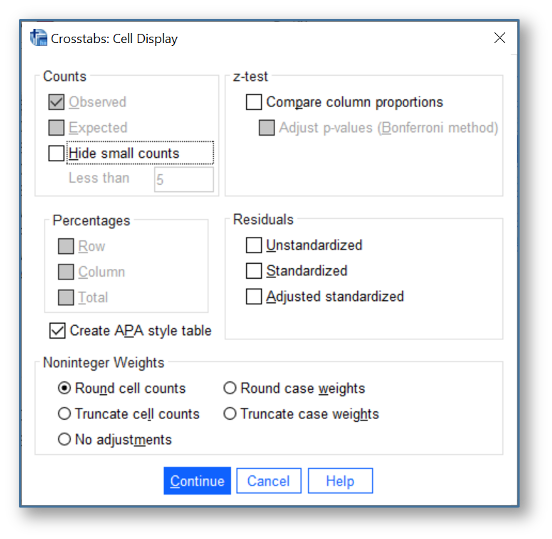
Figure 9 – The option to create APA style tables has been added to the Frequencies and Crosstabs dialogs
