

Installing the Watsonx.ai Text Categoriser Demo
- Download the Watsonx_ai Text Categoriser zip file and unzip the contents to a location of your choosing.
- Open IBM SPSS Statistics.
- In the main menu of the Data Editor window, click:
Extensions > Install Local Extension Bundle
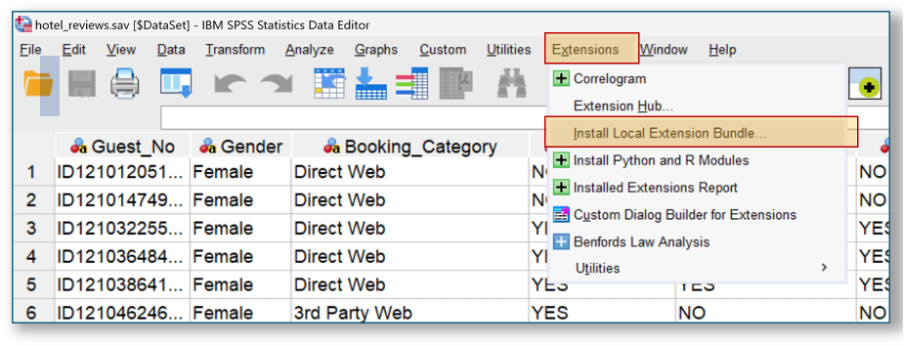
- In the Open an Extension Bundle dialog, navigate to where you unzipped the Watsonx_ai Text Categoriser file, chose the .spe file and click: Open
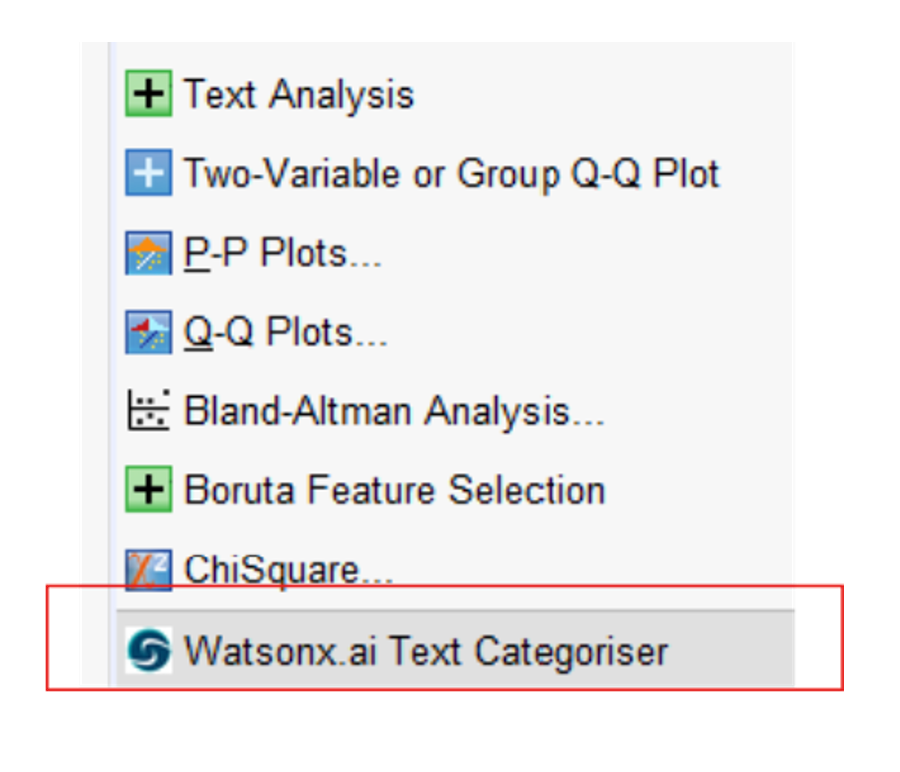
- The new Watsonx Ai Text Categoriser is installed at the bottom of the Analyze > Descriptive Statistics
Testing the Watsonx.ai Text Categoriser Demo
- In IBM SPSS Statistics open the sample SPSS data file that was bundled with the extension .spe
From the Data Editor window click:
File > Open > Data > Test Data for Text Categoriser Tenant Satisfaction.sav
- Navigate to the Text Categoriser click:
Analyze > Descriptive Statistics > Watsonx.ai Text Categoriser
- To test out the Discovery feature, simply add the variable response_text labelled What was you reason for giving that score? to the Target Text Variable box
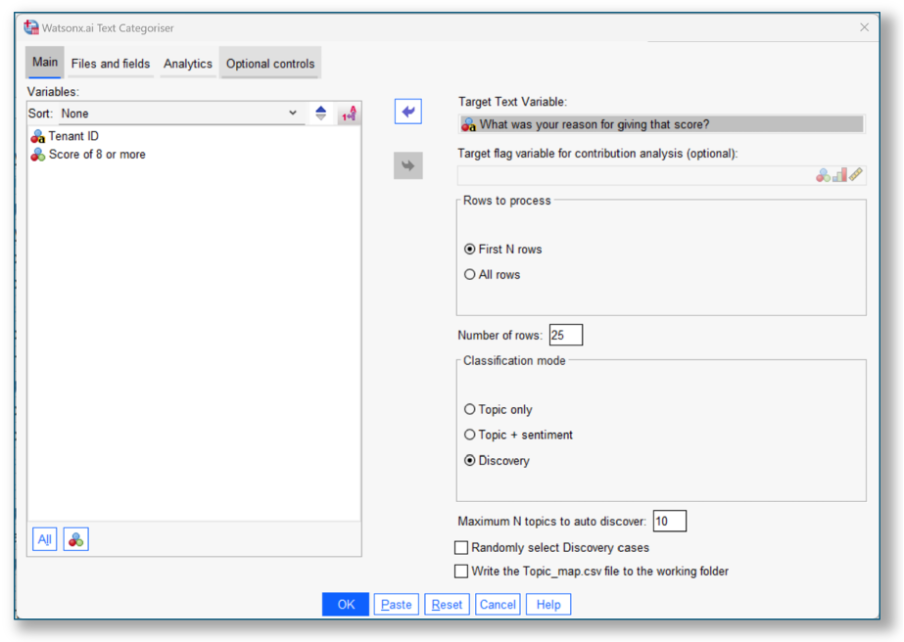
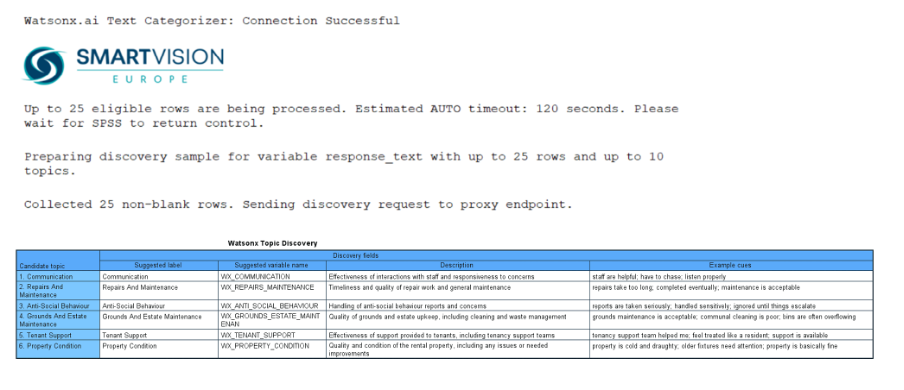
- Click OK. After a few moments, you should see output like the image shown below.
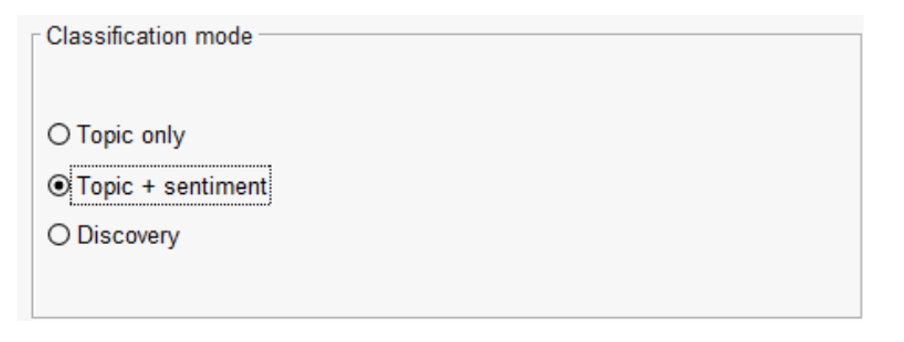
- To test out the Categorisation functionality, return to the Text Categoriser dialog, and choose the Topic and Sentiment option in the Main
- Add the variable Recommend_flag labelled Score of 8 or more to the Target flag variable for contribution analysis box
- Now switch to the Files and Fields tab and choose the topic map .csv file included in the zip bundle by clicking, the Browse button for the Topic map file (*.csv) Choose the file, Example_topic_map_tenant_satisfaction.csv (you can also edit this file).
- Finally, go to the Analytics tab and choose all the optional outputs in the checkboxes. To run the procedure, click OK.
You should see a series of charts providing information about 1) the various topic categorisations and their associated sentiment as well as 2) the relationships between the topics (if any) and 3) how they relate to whether respondents recommended the housing provider or not.
Using the Demo version of the Text Categoriser, you may process a maximum of 25 records per run for up to 25 separate executions.