Background to SPSS Modeler and overview of the CRISP DM methodology
Lesson 1a: Background and CRISP DM
Learning outcomes
- Understand how SPSS Modeler is used
- Overview of the CRISP DM data mining methodology
Video lesson
Lesson notes
How SPSS Modeler is used
Today SPSS Modeler is used extensively across many industries to address a very wide variety of business applications. These include:
- Predicting which current customers are likely to cancel their subscriptions so that phone or media companies may proactively intervene to retain their custom
- Identifying key equipment or assets at risk of failure so that utility companies may deploy engineering staff to prevent it occurring
- Using association analysis to uncover which groups of products are often purchased on the same occasion so that retailers can design promotions to drive more sales
- Predicting which patients are at risk of being re-admitted to hospital following discharge so that medical professionals can provide proactive care
- Early identification of fraudulent transactions for hotel companies so that they may take immediate action to mitigate the damage
- Segmenting donor behaviour for charities so that they may interact with their supporter base in a manner that reflects their personal profile
The Premium edition of IBM® SPSS® Modeler includes sophisticated Text Mining functionality. This additional functionality is used to classify and categorise unstructured data from sources such as call centre comments, social media feeds and document collections. Modeler Text Mining is also used to mine and extract data from engineer reports, error messages, insurance claims and medical notes to enhance the accuracy and clarity of predictive models.
CRISP-DM
Despite the media’s recent burgeoning interest in all things analytical, among the thousands of articles and discussion pieces devoted to big data analytics, data science, machine learning and artificial intelligence, very few dwell upon the practical aspects of ensuring analytical applications deliver tangible results, preferring instead to focus on the power and pitfalls of algorithms. Nevertheless, experienced data analysts are acutely aware that the success or failure of predictive analytics projects often rest on aspects of the process that have little to do with data modelling per se. In fact, the CRISP-DM methodology describes a process that many expert analysts follow when designing initiatives driven by predictive analytics. CRISP-DM stands for Cross Industry Standard Process for Data Mining. It is described as ‘a hierarchical process model’ for data mining applications, although in this context the term ‘data mining’ may be taken to mean ‘predictive analytics’.
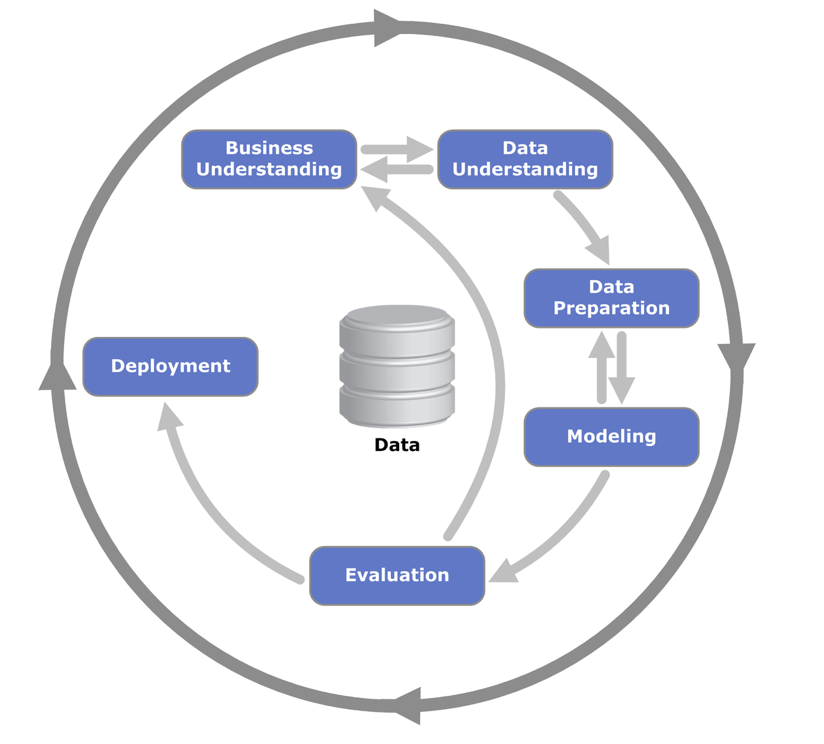
As can be seen in figure 1.1, CRISP-DM describes the predictive analytics process in terms of six main phases. A full description of the methodology explains each of these phases in greater detail and in fact each one can be broken down hierarchically into a set of tasks (generic tasks, specialized tasks and process instances).
As the figure below illustrates, the process of developing predictive analytics applications is cyclical in nature as each iteration seeks to correct faults and improve the outcomes. Moreover, you may notice that ‘Modelling’ represents only one of the phases in the development of the application.
Business Understanding
The first step in a new Predictive Analytics initiative is the Business Understanding phase. In fact, this is a critical step and one which is all too often glossed over. Spending time scrutinising why a particular subject has been chosen as the focus of a project may often yield valuable results. If for example, we are trying to predict which individuals are likely to renew a contract or insurance policy, how accurate should the model be in order to proceed? Among the predictions, how many false positives or false negatives are acceptable? What is the current policy renewal rate? What are the costs and benefits associated with say a 10% decrease or increase in renewals? This phase demands that we determine our success criteria early on. Furthermore, the Business Understanding phase tasks us with determining our project resources as well as the risks and assumptions that underpin the project. In fact, many initiatives are abandoned when subject to this level of scrutiny or are re-focussed on another aspect of the original business objective. Finally, Business Understanding requires us to produce an agreed upon project plan that documents all these elements.
Data Understanding
The Data Understanding phase aims to provide a thorough audit of the project’s primary raw material: data. It is likely that the available data are in more than one format. That the quality and quantity of the data will need to be inspected. The nature of the data, whether structured (quantitative) or unstructured (free text/audio/image) will need to be given due consideration. What do the actual fields within the data refer to? How many data are missing? How often are the data sources updated? If we are dealing with data that are related to customers or clients, then are there any pertinent aspects of the customer/client behaviour or demographics that we don’t have access to? In short, we are attempting to document the limitations and challenges associated with the project data early in the cycle so that we might better understand our chances of success.
Data Preparation
Many analysts regard the Business Understanding and Data Understanding phases as the most critical to the success of a project. However, many more analysts may agree that the Data Preparation phase is most time-consuming. Data preparation takes up time because it often involves numerous tasks associated with preparing data that was not originally collected with analysis in mind. As such, tasks such as data cleaning, merging sources, transforming file structures and deriving new measures are often among the most onerous in the project life-cycle. Often the analyst has a rough idea as to what the final data should look like in order to be ‘fit for modelling’. This may require, for example, the transformation of the data so that each row represents an individual person rather than a transaction, or a website visit or a product.
Modelling
As the name implies, the modelling phase involves the development of a model that addresses the project objectives. In fact, many modelling techniques allow analysts to build models automatically and quickly. This means that much of the time in this phase is taken up with trying different modelling techniques and tuning the selected models. Tuning the models may result in more useful results but so will transforming and manipulating the input data, so this phase has its own feedback arrow to the previous Data Preparation phase.
Evaluation
Having developed a (hopefully promising) model or set of models, the analyst must take time to assess its usefulness. There are many ways in which data analysts view the utility of a model, whether in terms of its complexity, clarity, accuracy or stability. In this phase, the analyst must also evaluate the model in terms of the original project objectives as documented in the Business Understanding phase. Does the model meet the performance criteria as determined at the outset of the initiative? Clearly, this a critical phase of the project and it may be that the evaluation indicates that the project should iterate back to the initial phase of the process and begin again from the start.
Deployment
The Deployment phase sees the fruits of all the previous work deployed into the real world. It is here that new data is fed into the model and the generated outcomes, in the form of risk scores, likelihood values, customer segments, classifications, anomaly indices, probabilities or forecasts are used influence decisions and actions. It may be that the initial deployment is done on the basis of a control and test scenario or that only a small proportion of the decisions are affected, but in either case, the results must be carefully monitored. In fact, it makes sense that the Deployment Phase includes the opportunity to create a maintenance plan for the model(s). After all, any predictive analytics model is unlikely to provide useful results indefinitely, so plans must be made to when and how often the model should be updated with more recent information or replaced entirely.