In April IBM released a new version of SPSS Statistics. The version 32 edition included new analytical procedures as well as some general usability enhancements. As always, after installing the software, users can see the details of each SPSS release by searching the Help system for ‘What’s new in SPSS’ or by clicking through the summaries of each feature in the What’s New section of the initial Welcome dialog.
Mediation Analysis
Mediation Analysis is a useful addition for users who already run procedures such as linear and logistic regression or make use of the GLM functionality. Indeed, SPSS users who previously ran mediation analysis have thus far tended to make use of the popular Process Macro developed by Andrew F. Hayes. Now that SPSS has its own native procedure, they may choose this alternative approach. Rather than merely asking if X predicts Y, mediation analysis investigates whether X affects Y through an intermediate variable (M). In practical terms, this helps users explain the mechanism behind an observed relationship.
Typical use cases include whether a training programme improves performance through engagement; whether health interventions affect outcomes through behaviour change; or whether an education intervention works through attendance or engagement. The new procedure supports continuous, binary and count outcomes in relevant combinations as well as performing subgroup analysis. In terms of graphical output, it can create path diagrams, scatterplots, and forest plots with confidence intervals using either delta-method or bootstrap approaches.
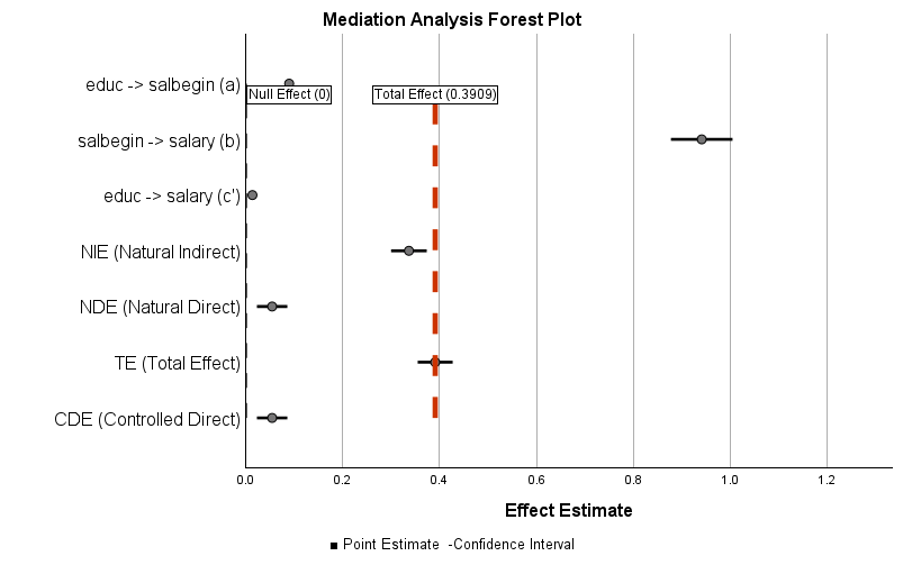
Mediation Analysis Forest Plot with Confidence Intervals
Vector Autoregressive (VAR) Models
The Vector Autoregressive Models (VAR) procedure extends the existing SPSS time-series modelling capabilities from a single dependent series to a system of related series. Using VAR, each endogenous variable can be explained by its own lagged values and by lagged values of the other variables in the system. This is especially useful when variables are likely to influence each other over time rather than acting as isolated outcomes.
Applications for VAR include forecasting monthly sales by product category, pricing and demand, whilst employing exogenous economic indicators such as such as inflation and consumer price indices. The SPSS v32 VAR procedure allows optional lag selection using AIC, BIC or HQIC, and includes model diagnostics, residual tests, forecast plots, fitted values and saved predicted/residual datasets.
This new procedure may well be of particular interest to SPSS Forecasting users, market researchers, finance analysts and demand planners who want to make use of time-series modelling with multiple dependent variables from within the SPSS interface. This procedure is available in SPSS Statistics Professional Edition or with the optional Forecasting module.
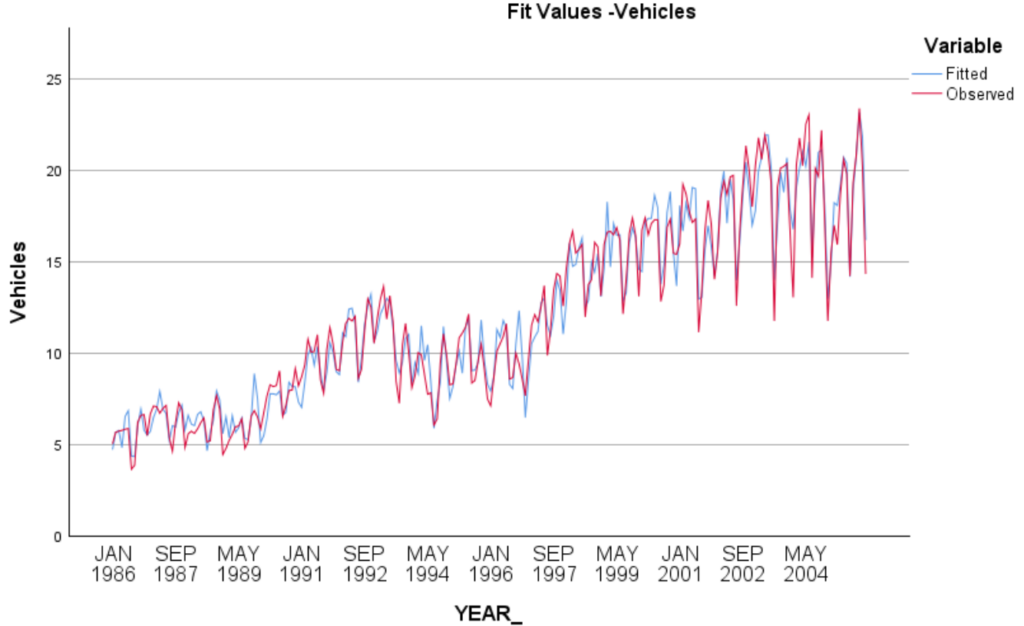
Output from the Vector Autoregressive (VAR) Models procedure
Genomic Analysis
The new Genomic Analysis procedure allows SPSS users is to convert FASTQ/FQ sequencing files into an SPSS-ready quality-control dataset and then analyse those QC metrics with familiar SPSS procedures. The GENOSTAT workflow can ingest multiple FASTQ files, handle adapter checking, process files as background jobs, and produce output for descriptives, frequencies, correlations and regression.
Each imported FASTQ file becomes a case in an SPSS dataset. In doing so, the procedure creates 27 QC variables covering sequencing yield, read structure, base composition, Phred quality, duplication, adapter content, low-complexity reads, unexpected bases, overrepresented sequences and FastQC-style pass/warning/fail indicators. Lab analysts can then use these data to compare samples, flag outliers, assess batch or run quality, and document which files are suitable for downstream variant-calling or other specialist pipelines.
This new procedure is likely to be of interest to life-science researchers, clinical research teams and genomics specialists that already use SPSS for statistics and reporting but need a simpler way to summarise sequencing QC. Genomic Analysis in v32 is a built-in dialog rather than an Extension Hub procedure and be found under the Transform menu. It should be however be seen as QC and statistical summarisation, not as alignment, variant calling, annotation, assembly, RNA-seq differential expression or GWAS.
Curated Help Designer
The new Curated Help Designer in v32 introduces a strong usability and training capability. The designer lets advanced users or administrators create conditional guidance for output-table cells based on numeric value ranges in the statistics dimension. As such, they can define range titles, summaries and colour indicators, then apply them to relevant pivot-tables that contain a statistics component. Custom curated help can be imported/exported as a ZIP file and supports multiple output languages.
This functionality is likely to be of help where SPSS output is shared with less experienced users. For example, teaching staff could attach custom explanations to correlation, t-test or regression output and experienced analysts can attach standard interpretation guidance to p-values or fit measures.
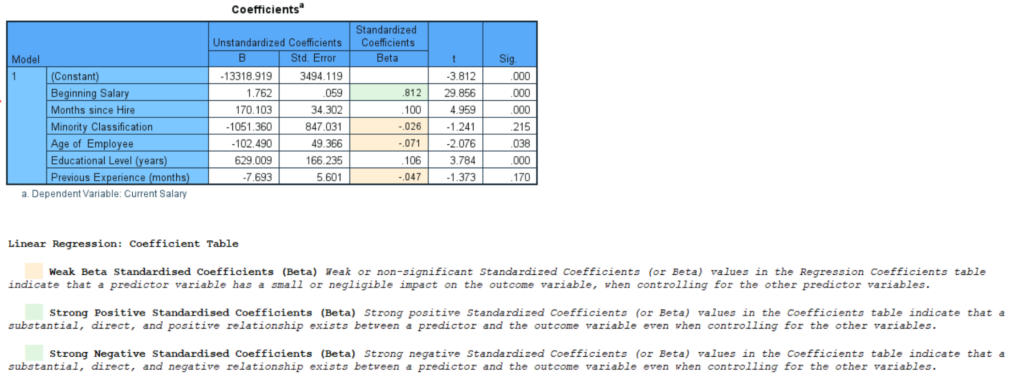
Custom curated help for regression coefficients table
Output Viewer, Chart Builder and PROPORTIONS
A new addition to the Output Viewer is the introduction of a targeted Show Column option. This allows users to restore specific hidden columns without revealing every hidden category. This represents a small but valuable change for SPSS users who prepare publication tables or client reports. The SPSS Chart Builder also now generates simpler default chart titles by removing redundant chart-type wording. The PROPORTIONS procedure adds a footnote clarifying that Asymptotic Standard Error columns in confidence-interval and test tables are calculated without assuming the null hypothesis, thus aligning the interpretation with comparable CROSSTABS output.
Extension Hub procedures and R-based enhancements
On top of the native SPSS Statistics procedures, IBM has added four analytical Extension Hub procedures with an R plug-in dependency.
| Extension name | Usage | Useful for | Pathway |
| STATS PERM | Permutation tests for simple two-group t tests, ANOVA and regression; useful when normality or asymptotic assumptions are weak. | Small-sample researchers, experimental analysts, teaching labs. | Analyze > Regression > Permutation Tests |
| STATS_PERMTTEST | Windows-specific independent-samples t tests including equal-variance/Welch and one- or two-sided alternatives. | Users requiring a less assumption-heavy alternative to the classic independent or paired-samples t tests | Analyze > Compare Means and Proportions > Independent Samples Permutation t Tests |
| STATS BAYES SELECTVARS | Bayesian variable selection for linear and generalized linear regression using Bayes-factor comparisons. | Model-building users comparing candidate predictors. | Analyze > Generalized Linear Models > Bayesian Regression Variable Selection |
| STATS MIXED CLUSTER2 | Mixed-type clustering with simultaneous variable selection and cluster-number determination; can save a model for scoring new cases. | Segmentation, latent-class style clustering, market research, behavioural analytics. | Analyze > Classify > Mixed Type Cluster with Variable Selection |
A related enhancement supports configuring a custom CRAN mirror for R-based extensions through the CranURL key in spssprod.inf. This mainly benefits enterprise, government, university and offline/restricted-network environments where the public default CRAN URL is blocked or where only approved package mirrors may be used.
Authentication and Security
SPSS Statistics Digital now supports passkeys for signing in with an IBMid. Passkeys provide a secure, password‑free sign‑in experience using the authentication features available on your device, helping simplify access to the product.
A further security/privacy enhancement is the option to allow administrators in restricted environments to completely disable and remove the recently added AI Output Assistant from the user interface.
All in all, the v32 release of IBM SPSS Statistics contains a plethora of new features designed to increase the platform’s analytical prowess as well as introduce a number of enhancements to the product’s usability and generated outputs.