In September this year, IBM released the latest version of SPSS Statistics. Version 29 introduces some new analysis procedures and includes more recent versions of R and Python
Parametric Accelerated Failure Time (AFT) Models
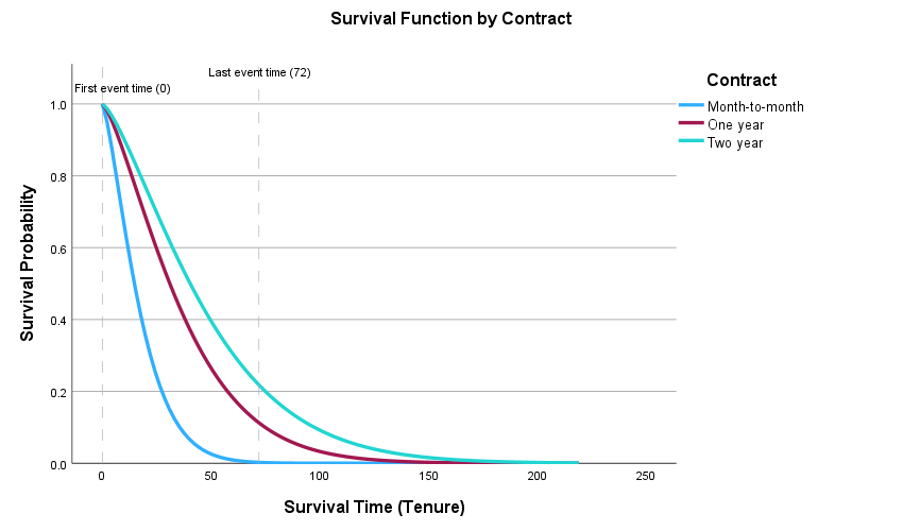
Version 29 brings a new addition to the SPSS family of Survival analysis procedures. Unlike the existing Life Tables, Kaplan-Meier and Cox Regression procedures, the newly added Accelerated Failure Time Model is parametric in nature. This means it is assumed that the dependent variable follows a specific distribution. Parametric models are often regarded as less flexible than non-parametric models but if the outcome variable follows an identifiable distribution, these kinds of procedures can be very powerful. Whereas proportional hazards models assume that the effect of a covariate is to multiply the hazard by some constant, an AFT model assumes that the covariate effects accelerate or decelerate survival by some constant. This capability may be useful be useful for researchers investigating time-to-failure as part of a preventive maintenance regime, especially when factors such as the location of a physical asset is known to accelerate or decelerate the time-to-failure.
The new procedure supports parametric models based on the Weibull, Exponential, Log-Normal and Log-Logistic distributions. This new feature requires the SPSS Statistics Standard Edition or the Advanced Statistics Option.
Linear OLS Alternatives: Lasso, Ridge and Elastic Net
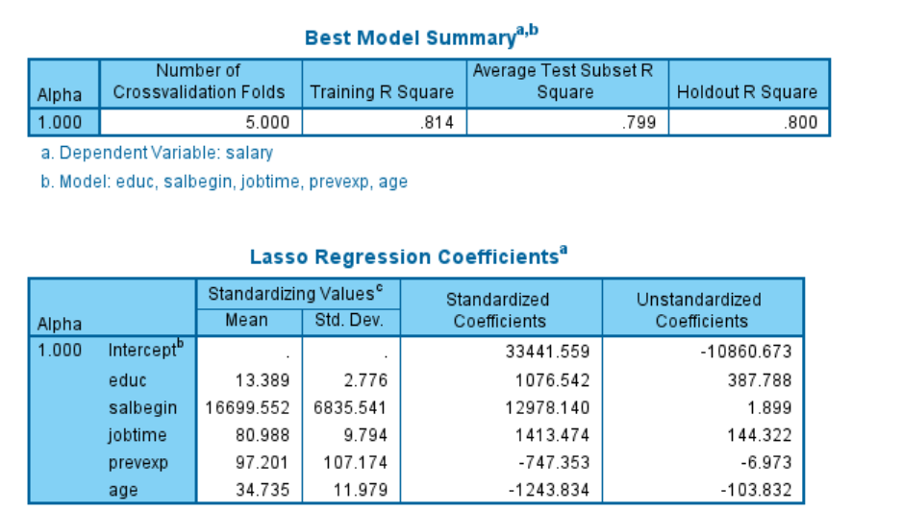
Version 29 also includes the option to install three new regression procedures that employ different forms of regularization. The Lasso, Ridge and Elastic Net procedures can now be added to the Regression sub-menu. Using Python’s machine learning library, Scikit-learn, these procedures can be quickly installed as extensions.

All of these techniques are optimised to prevent problems of over-fitting that are commonly associated with ordinary least squares regression. Generally speaking, these regularization techniques work by penalizing large model coefficients.
Lasso
Often referred to as L1 regularization, the Lasso procedure (Least Absolute Shrinkage and Selection Operator) works by penalising the least important features, shrinking them towards zero. It is therefore useful for feature selection, as the weak variables are effectively nullified, thus simplifying the final model.
Ridge
L2 regularization, known as Ridge regression, tends to penalize coefficients in a more even manner than L1. As well as creating more generalisable models, it’s commonly employed when dealing with issues of multicollinearity.
Elastic Net
Elastic Net combines Lasso (L1) and Ridge regression (L2), which may result in a more balanced model if each individual method is in some way sub-optimal.

Pseudo-R2 measures in Linear Mixed Models and Generalized Linear Mixed Models
The output from Linear Mixed Models and Generalized Linear Mixed Models output now include pseudo-R2 measures and the intra-class correlation coefficient. R2 is a commonly reported fit statistic indicating the proportion of variance explained by a linear model. The intra-class correlation coefficient (ICC) is a related statistic that indicates how much variance is explained by a grouping (random) factor in multilevel/ hierarchical data.
Unselected cases can be viewed again
Unselected cases are no longer hidden in the Data Editor when a subset of cases is selected, and the unselected cases are not discarded. This represents a return to the behaviour of Statistics 27.0.1 and earlier versions.
Violin Plots
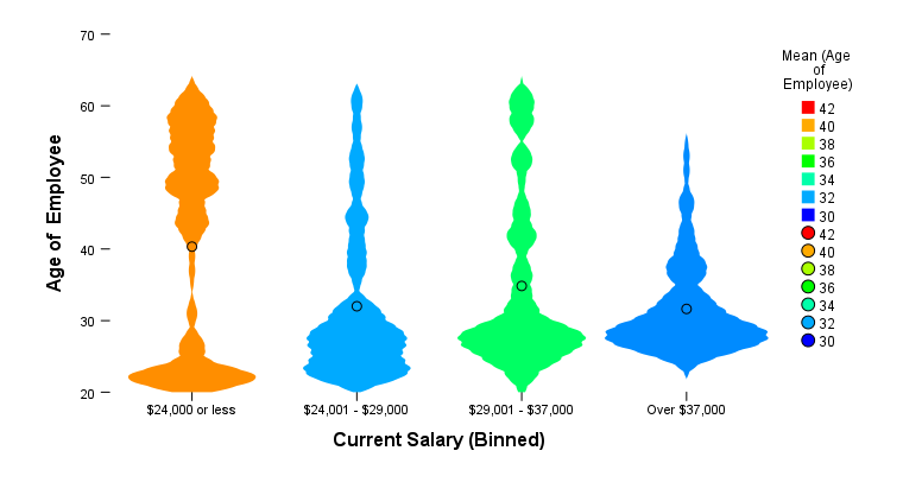
Violin plots have been added to the Graphboard Template Chooser. These plots are a hybrid of the box plots and kernel density plots. Violin plots show peaks in the data and are used to visualize the distribution of scale variables. Unlike a box plot that can only show summary statistics, violin plots depict summary statistics and the density of each variable.
Workbook mode enhancements
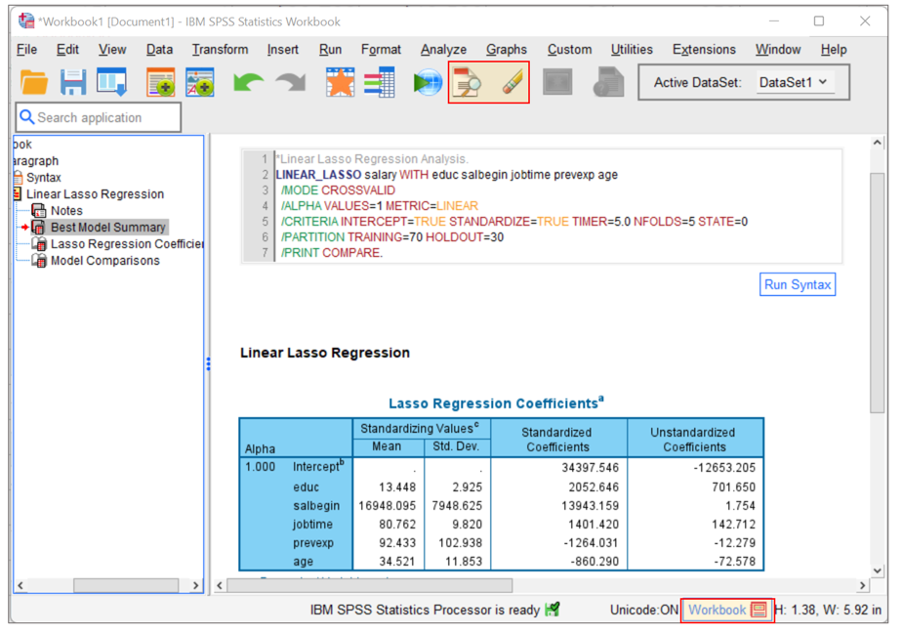
Two new toolbar buttons have been added for users working in Workbook windows: Show/Hide all syntax windows and Clear all output. Also, a new button has been added to the Status bar that enables users to quickly switch between Classic mode (Output and Syntax windows separate) and Workbook mode.
Search enhancements
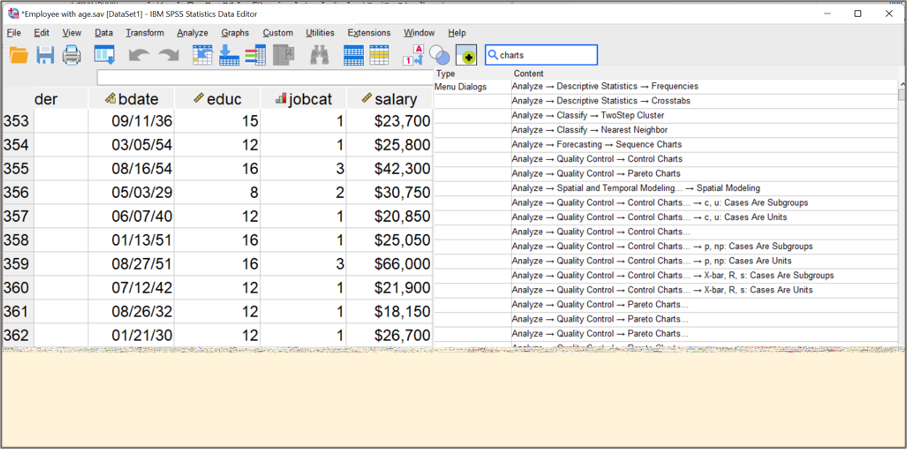
Lastly, the Search feature now provides options for entering terms directly into a toolbar allowing users to view search results in a drop-down pane.
