The Unscrambler Suite from Camo Analytics offers modeling, prediction and optimisation
Unscrambler is the industry leading tool for modeling, prediction and optimisation using sophisticated analytics and advanced data visualisations. The combination of these unrivalled capabilities will enable your organisation to develop products faster, continually improve product quality and the ongoing optimisation of processes. It is the chosen tool set for more than 25,000 scientists, researchers and engineers providing a robust solution to analyse large and complex data sets quickly, easily and accurately.
How can Unscrambler from Camo Analytics help your organisation?
Product development
Developing new products, which ever industry you operate in, is a costly and time-consuming activity. It also carries a level of risk. Using the Unscrambler suite you will be able to accelerate product development and reduce the time taken to get products to market and to enhance existing products. Use of the the design of experiments (DoE) capabilities will enable you to create product designs that are less sensitive to variations in raw material quality or properties.
Production optimisation
The challenge of improving production yields, process efficiency or Overall Equipment Efficiency (OEE) can be an iterative process and it is difficult to know exactly what will drive the best outcomes. The ability to be able to model and optimise processes with the Unscrambler analytics suite will provide you valuable insights on which factors have the highest impact on performance and efficiency.
Process control
You will be equipped to monitor the effectiveness and performance of your manufacturing processes with the Unscrambler Process Pulse. This will increase you ability to keep your batch and continuous operations running smoothly and efficiently. Process Pulse provides an intuitive multivariate control chart which includes early fault detection and process deviation warnings. This will allow operators to pro-actively stop quality or inconsistency problems occurring in continuous manufacturing processes.
Quality assurance
Regardless of the way that your organisation measures and assesses the quality of your products, the addition of Unscrambler Process Pulse, to your quality assurance toolset, you will be able to ensure that the quality of every single unit is correct. Process Pulse is able to monitor the quality in each step of the process and will deliver an exact assessment of the composition, physical, and sensory properties of the product. This will comprehensively ensure verifiable quality assurance.
Discover the power of Unscrambler:
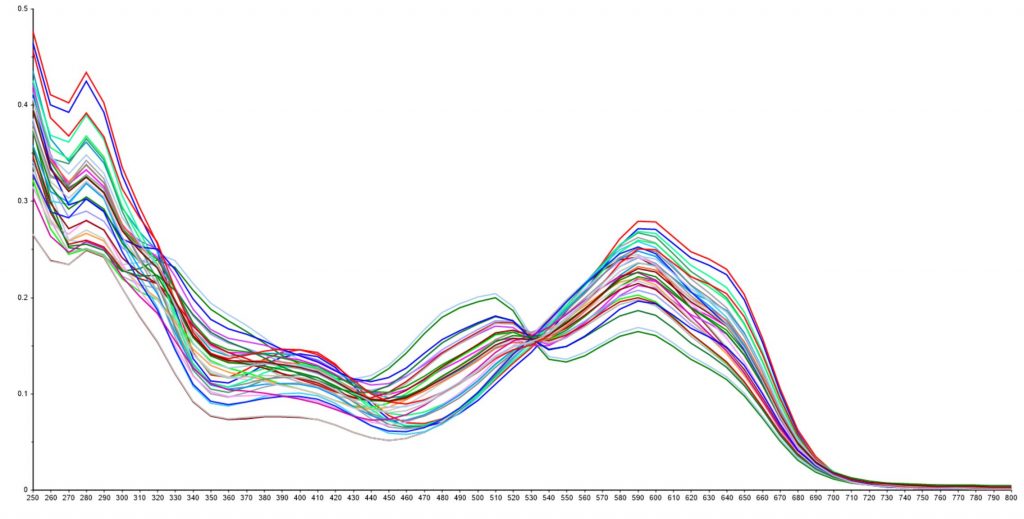
Powerful analytics, interactive graphics and visualisations, with unique capabilities for spectroscopy and chemometrics.
Unscrambler has been developed to solve complex problems using powerful multivariate analysis, with unique capabilities for spectroscopy and chemometrics.
Choose from more than 20 different methods to analyse data, including design of experiments (DOE), exploratory data analysis, Partial Least Squares Regression (PLSR), Principal Component Analysis (PCA) and Soft Independent Modelling of Class Analogies (SIMCA).
In addition Python gives access to thousands of free scripts for use in Unscrambler with additional methods for import, pre-processing and machine learning. Easily explore and validate models through interactive graphics and visualisations to optimise product development, improve product quality and process efficiency.
Watch a video demo of Unscrambler
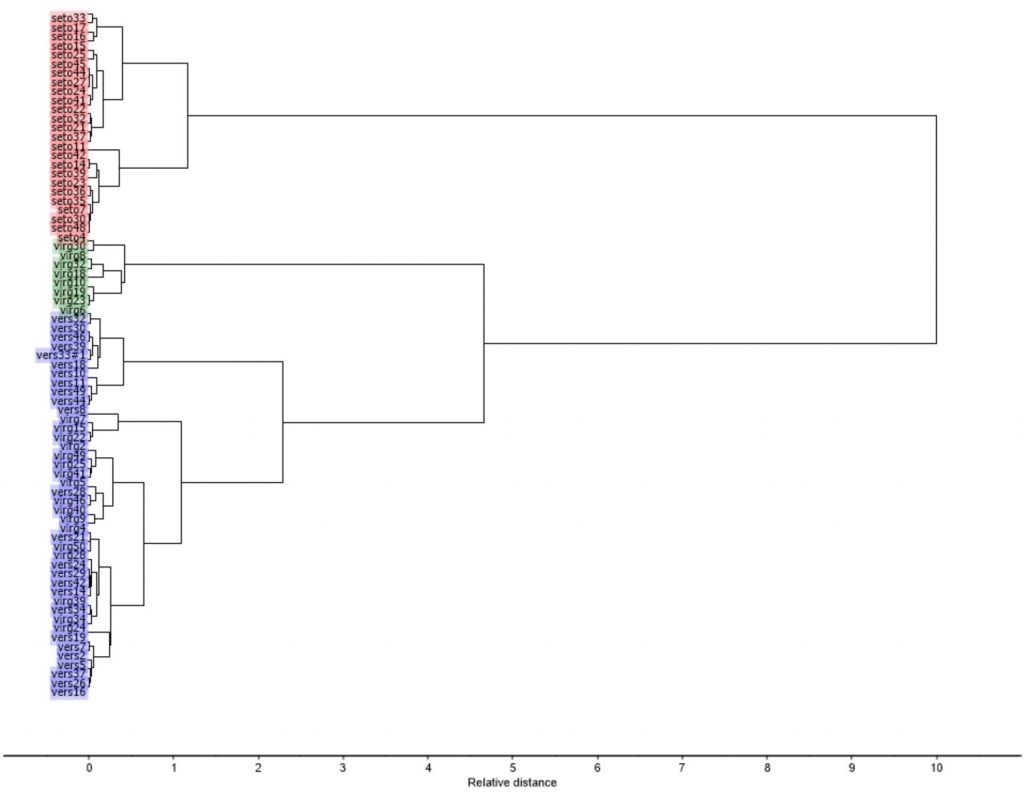
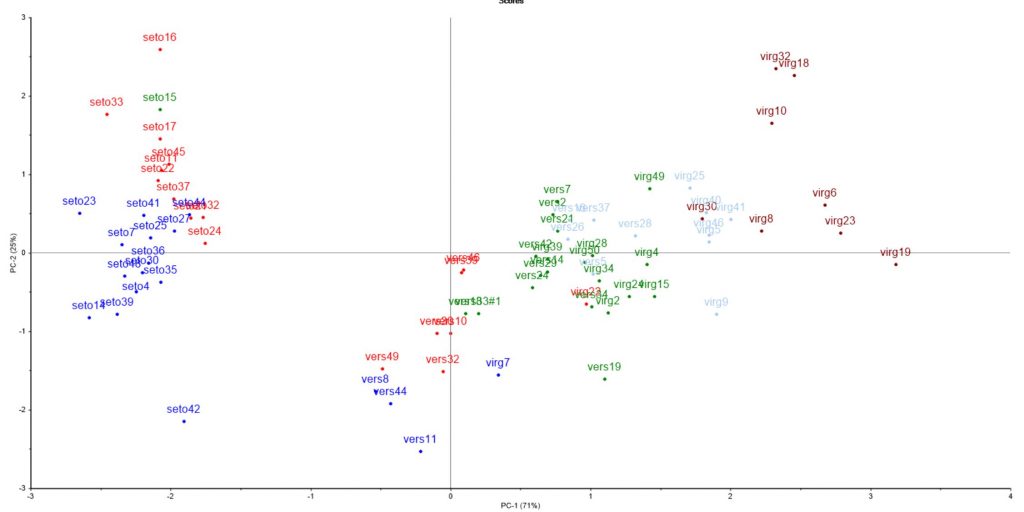
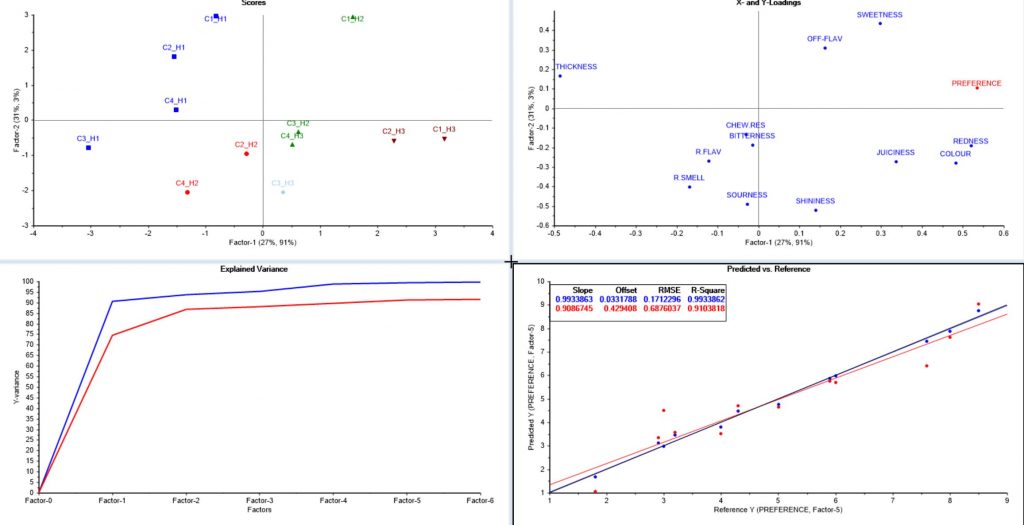
This four part video shows Principle Component Analysis and Partial Least Squares using Unscrambler within the context of a food product development application. The videos focus on:
- Sensory data analysis with PCA
- Exploring the relationship between the sensory data and laboratory instrumental data with Partial Least Squares (PLS)
- Predicting user preference (‘consumer liking’) from sensory measurements with Partial Least Squares (PLS)
