In June of this year, IBM released the latest iteration of SPSS Statistics – you can see a summary of the core changes in our earlier blog. In this blog we take a deeper dive into some of these changes and what they mean for users.
The version 31 release included a number of enhancements that include new analytical techniques as well as general usability improvements. In fact, users can see the details of each SPSS release by searching the Help system for ‘What’s new in SPSS’ or by clicking through the summaries of each feature in the What’s New section of the initial Welcome dialog.
Coefficient of Variation
The Frequencies, Descriptives and Ratio Statistics procedures now include an additional measure of dispersion in the form of the Coefficient of Variation. This value represents the ratio of the standard deviation to the mean. The values themselves are expressed as percentages. As such, it standardises variation estimates and shows researchers how big the average deviation is relative to the size of the mean.

Requesting the CV measure in the Frequencies procedure

Frequency summary statistics table showing the CV measure
Homogeneity of Variance
Another change that IBM have introduced, is removing the automatic inclusion of Levene’s Test of Homogeneity of Variance when performing an Independent Samples T-Test. Many users found the presence of this additional significance test confusing. As a result, the procedure may be requested as an additional test in the main dialog rather than included by default.

Independent Samples T-Test with optional Homogeneity of variance test
Chi Square
One of the most popular significance tests in SPSS (and statistics generally) is the Chi-Square Test of Independence. Normally users, access this test via the Crosstabs procedure where it creates additional output. Now, in addition to the Crosstabs procedure, users may request the test directly by clicking Analyze > Descriptive Statistics > Chi Square.
Curated Help
IBM states that Curated Help “is a feature that analyzes the output of a procedure and provides a summary of key findings”. The most obvious example of this is shown when users perform a correlation analysis. The procedure now applies additional formatting routines that colour code the correlation values in terms of their strength. From a vibrant green for strong positive correlations, to a bright fuchsia for strong negative correlations. It also includes a colour coded legend to aid interpretation and notes which correlation pairs fall into each band.


Output showing curated help for the Bivariate Correlations Procedure
Fill Image
Using the Graph Builder with the new Fill Image option in the Properties dialog, you can now add background images to charts.

Adding an image to the background of a chart
Retaining Column Width Changes
Users could always manually change the default display of the column widths of the various properties as they appear the Variable View (e.g. Name, Type, Label etc). By doing so, you can customize how wide each column for that property appears. A new aspect of SPSS v31 is that having done so, these custom display widths are saved and retained across sessions.
Change Common Properties
Another new feature of SPSS v31 is that if you right-click anywhere in the Variable Properties window, you will see an additional item listed on the resultant pop-up menu. The Change Common Properties function opens a dialog where you can set the following attributes of multiple variables at the same time: Width, Decimal, Align, Measure and Role. Simply drag the cursor or use shift-click or ctrl-click to select the variables where you wish to change these properties, then right -click and choose Change Common Properties from the pop-up menu to set the attribute values for your selection.
Output themes
The default options in SPSS v31 now offer the opportunity for users to save their output settings as a ‘theme’. Clicking Edit > Options and choosing the Output tab, reveals a new Output Theme section which allows you to save the current Viewer settings as well as the display options for Pivot Tables and Charts under a single theme name. By creating theme names such as Standard, Presentation or Client, users than seamlessly switch between different output and Viewer display settings more quickly.
New Analytical Functionality
Distance Correlation
Distance Correlation is a new method in SPSS that assesses both linear and nonlinear relationships between variables. It can be accessed from the main menu by clicking Analyze > Correlate and it provides a more comprehensive measure of dependence than traditional bivariate correlations like Pearson’s, which are limited to detecting only linear associations. This makes it a powerful tool for demographic, financial and medical data where relationships are often nuanced and not easily represented by straight-lines. The Distance Correlation procedure examines pairwise distances among cases. In doing so, it computes a coefficient (dCor) which ranges from 0 to 1 whereby values equal to 0 indicate that the paired variables are independent.

Proximity Mapping
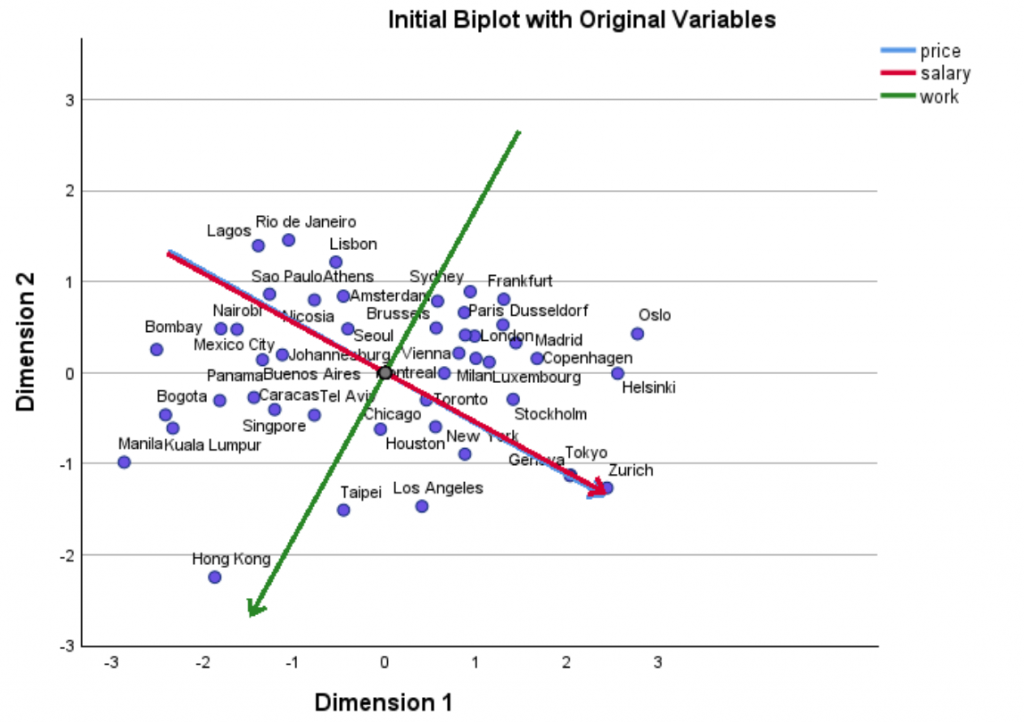
Proximity Mapping (PROXMAP) is a new SPSS v31 analytical procedure that takes or creates similarity/dissimilarity (“proximity”) information from either a raw proximity matrix or from numeric, ordinal, or nominal variables and fits a spatial ‘map’ where nearby points represent more-similar objects (or cases) and distant points represent less-similar ones. Proximity Mapping allows researchers to visualize the structure and relative positioning of objects (e.g., brands, perceptions, social groups). The PROXMAP procedure allows researchers greater flexibility than methods such as PROXSCAL especially with regard to the range of input types it can handle and its ability to utilise proximity information from multiple sources simultaneously.

Output from the Proximity Mapping procedure
Conditional Inference Tree
SPSS v31 now includes new analytical functionality that can also be downloaded and installed from the Extension Hub (under the Extensions menu). The Conditional Inference Tree procedure is a component of the R package partykit. Although this tree-based package lacks the kind of interactive and editing functionality one might associate with the output created by the native SPSS Decision Trees module, as a technique, Conditional Inference Trees tend to be more resistant to issues like overfitting. Moreover, Conditional Inference Trees are better at using test statistics appropriate to the predictor’s level of measurement (whether nominal, ordinal or scale) whereas methods such as CHAID tend to discretize/merge continuous predictors, which can throw away information or over-simplify their effects. The method also tends to perform better with unbiased variable selection by separating which variable to split on (via a global test of independence) from where tosplit. This helps to minimise Type-I errors and avoids the classic bias of choosing variables with many categories or many potential cut points. The Conditional Inference Tree procedurealso includes Model–Based Tree methods,such as linear and logit, which can be invoked when partition variables are available.

Output from Conditional Inference Tree
Time Series Filters
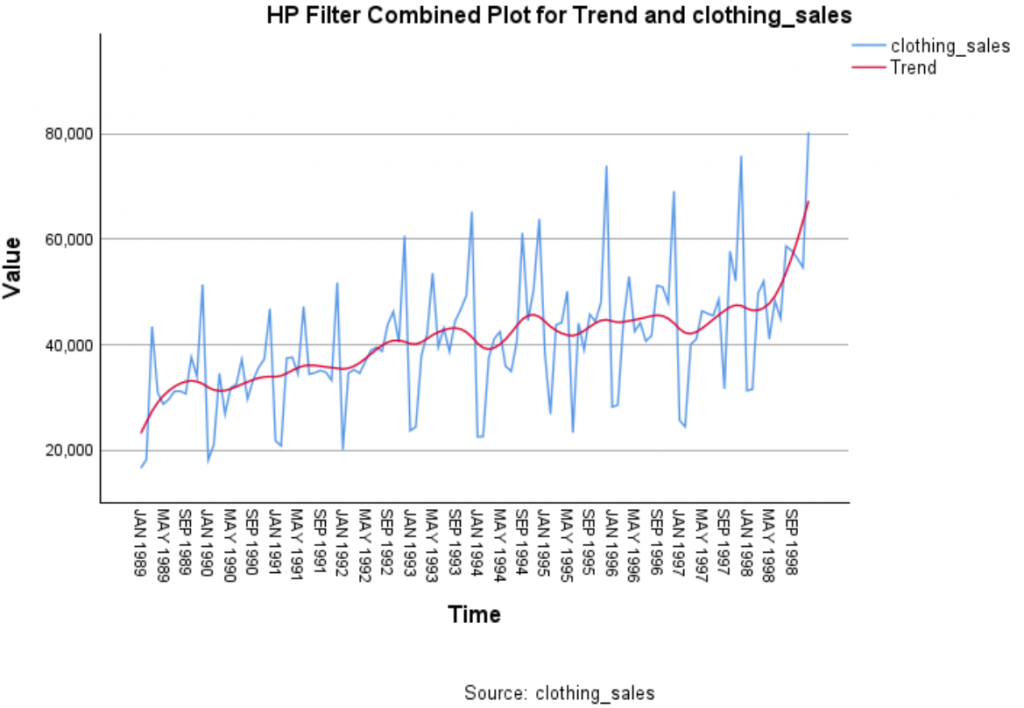
Time series filtering is a commonly used technique in time series analysis that which can be employed to decompose time series into trend and cyclical components. Time Series Filter is another new procedure that can be downloaded from the extension hub where it will be installed under the Analyze > Forecasting menu. Based on the python package statsmodels, the procedure offers three filtering methods: Hodrick-Prescott, Baxter-King and Christiano-Fitzgerald. The Hodrick-Prescott (HP) filter is used to fit a smooth trend to time series. TheBaxter-King (BK) method is a band-pass filter useful for isolating cyclical components of data. Finally, the Christiano-Fitzgerald (CF) filter is another band-pass filter method used to separate a time series into trend and cyclical components.

Output showing Hodrick-Prescott (HP) filter applied to a time series
Stats Earth (Multiple Adaptive Regression Splines)
The Stats Earth procedure is another R based routine that can be downloaded and installed from the Extension Hub. The procedure is installed under the Analyze > Generalized Linear Models menu where it is labelled Multiple Adaptive Regression Splines. Utilising the R package earth, this algorithm is useful for those interested in performing regression analysis with a focus on detecting nonlinearities and interactions. In particular, this method’s ability to find breakpoints and slopes directly from the data is often used in financial applications such as price elasticity modelling, risk scoring and credit or insurance rating. More generally, it is useful for real-world regression applications that are challenged by non-linearity and interaction effects within the data.

Output from the Stats Earth (Multiple Adaptive Regression Splines)
All in all, the v31 release of IBM SPSS Statistics contains a plethora of new features designed to increase the platform’s analytical prowess as well as introduce a number of enhancements to the product’s usability and generated outputs.


