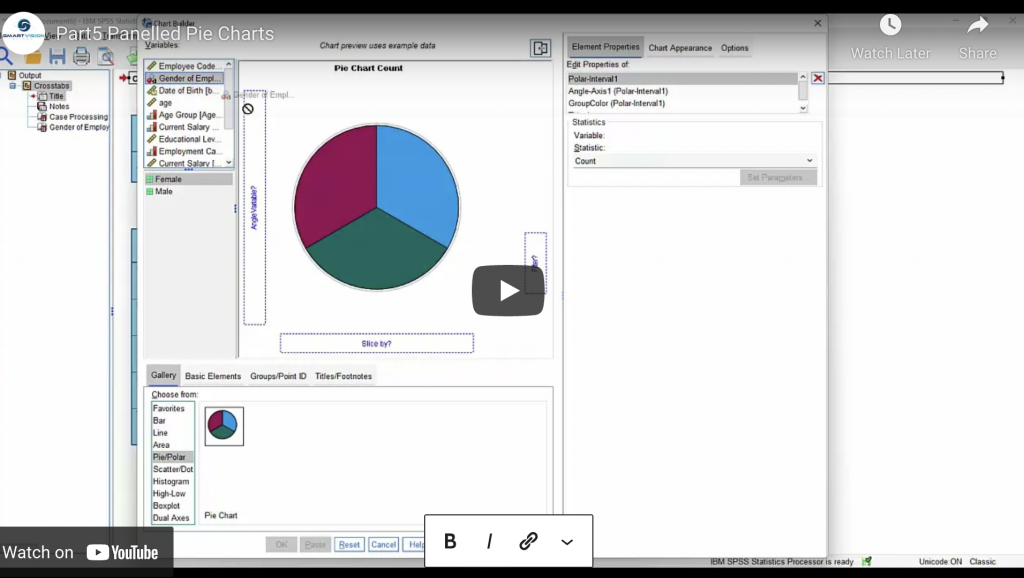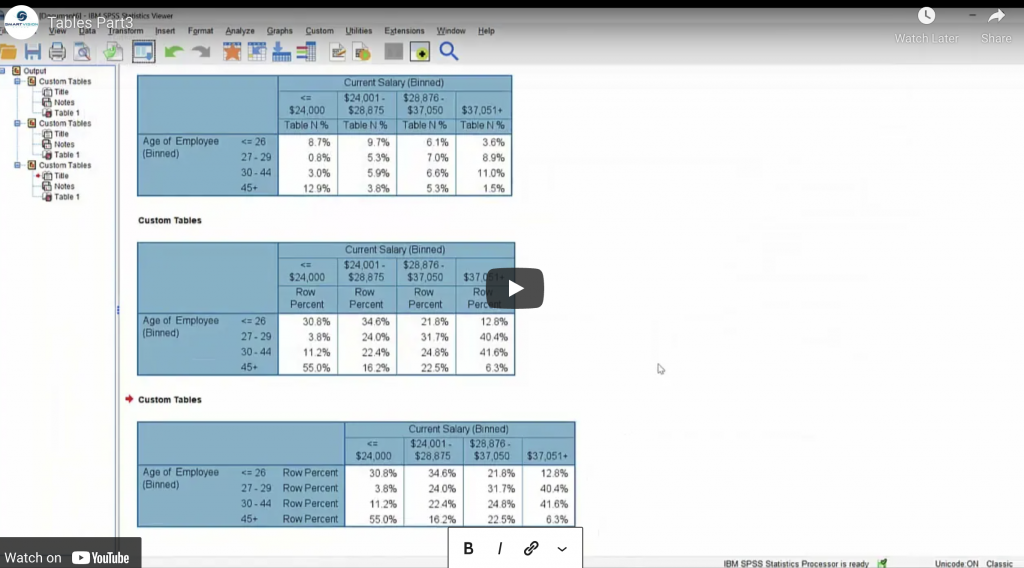
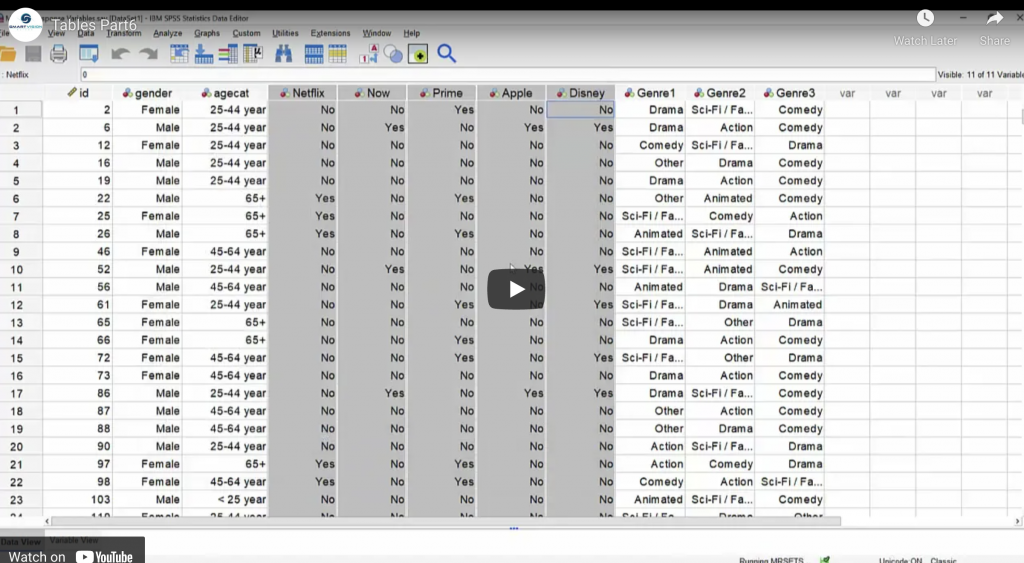
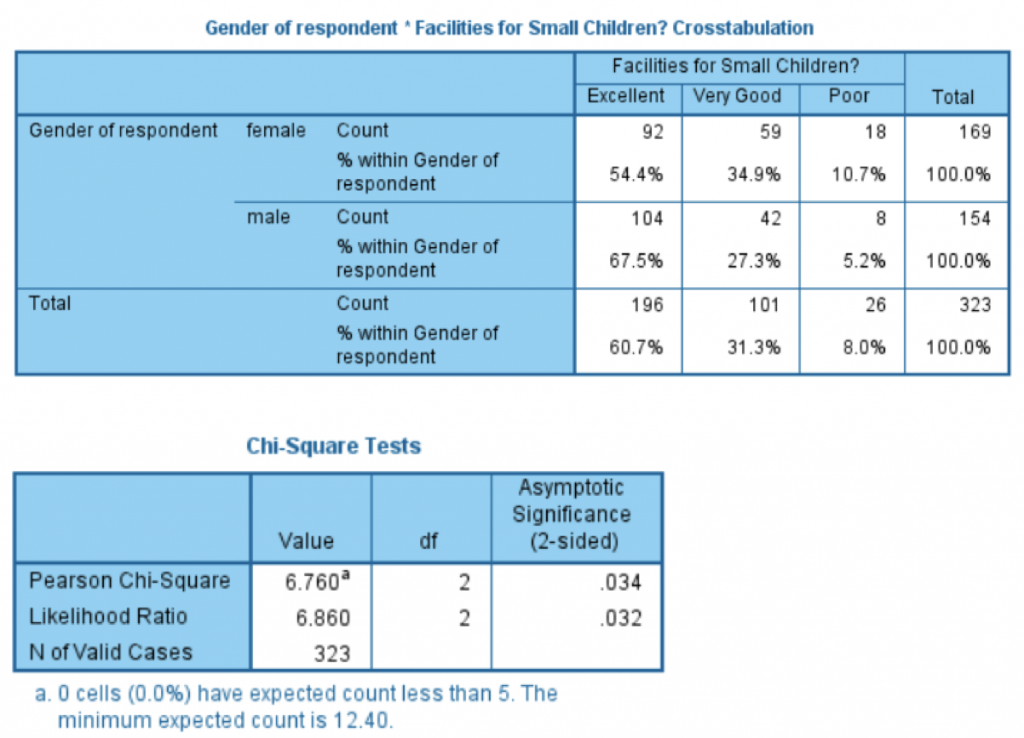
Percentages, totals and layers
In this series of videos, Jarlath Quinn explores the rich tabulation functionality In the SPSS Custom Tables module.
In this series of videos, Jarlath Quinn explores the rich tabulation functionality In the SPSS Custom Tables module.
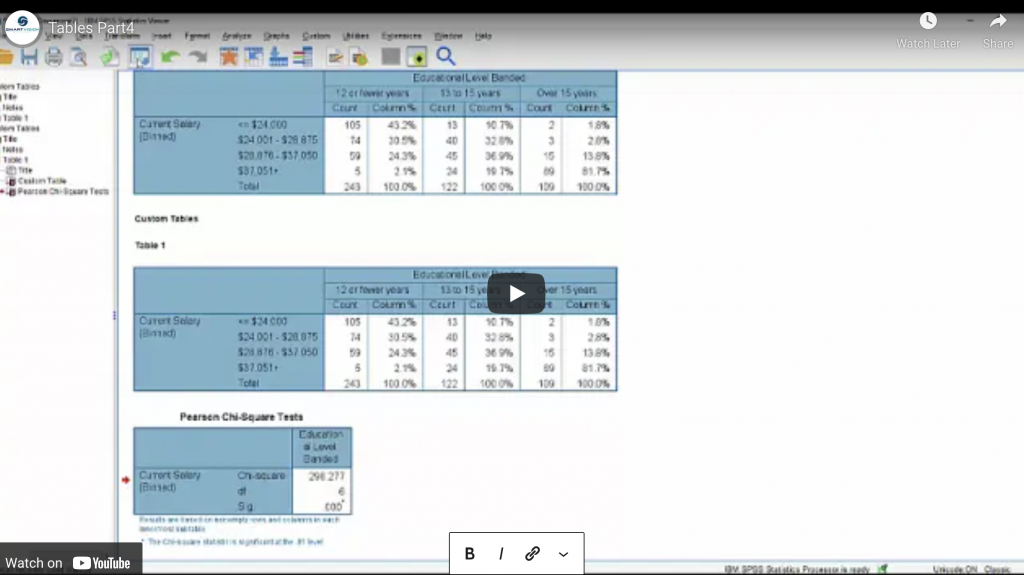
A video guide to performing tests of significance in the SPSS Custom Tables module.
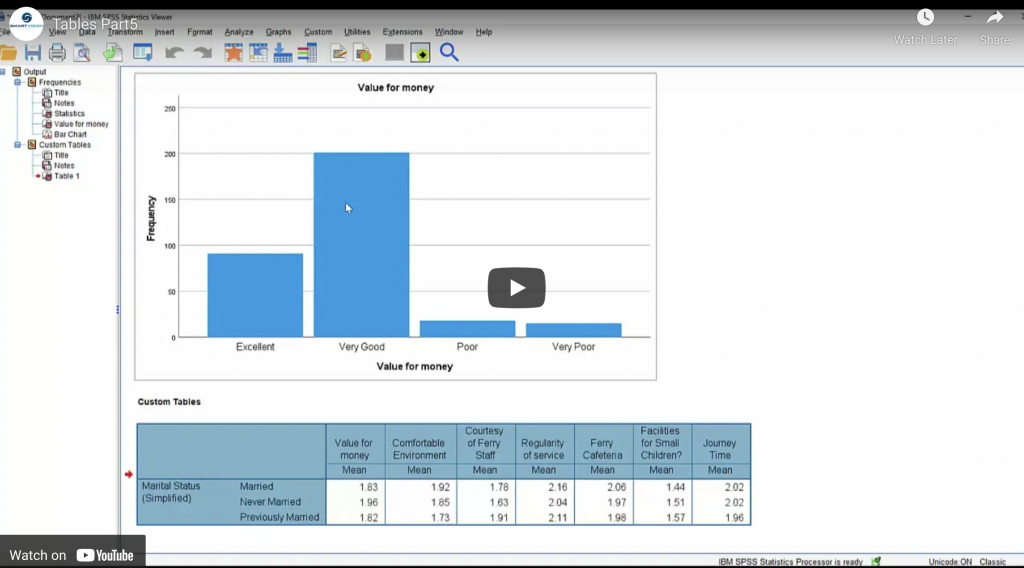
In this series of videos, Jarlath Quinn explores the rich tabulation functionality In the SPSS Custom Tables module.
In this series of videos, Jarlath Quinn explores the rich tabulation functionality In the SPSS Custom Tables module.

Lorna – Can you start just by telling me a little bit about your background and how you came to be where you are now in your career? Bethan – I started out doing a maths degree at Lancaster University. And then I did a master’s in operational research, which was data science really, just …
Expert insights: Bethan Blakeley, Analytics Director, Boxclever Read More »
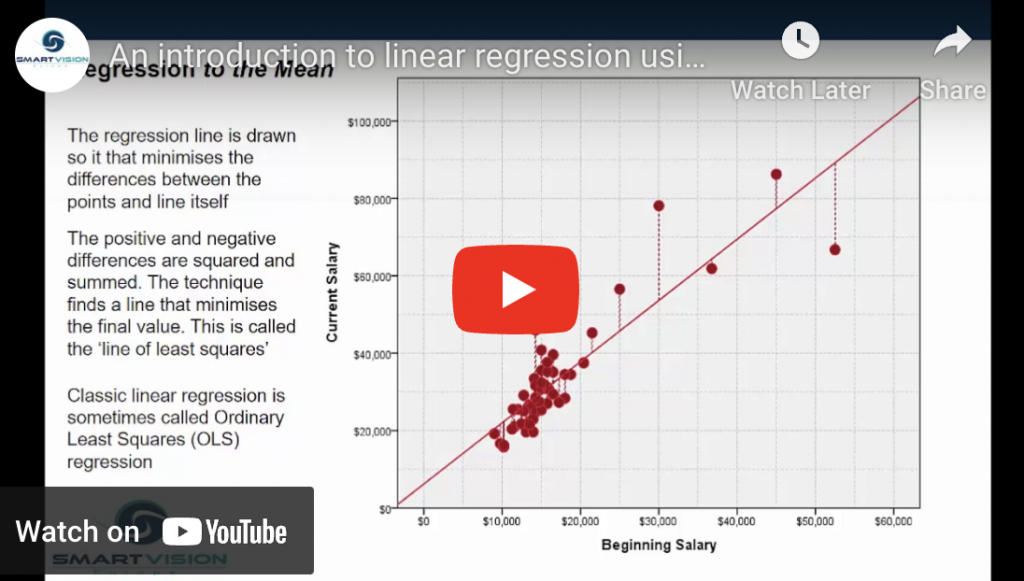
In classical statistics, linear regression is regarded as the ‘gateway to predictive modelling’. For decades students have been taught about regression from theory to practice simply because it still one of the most versatile and simple ways to understand and predict the effect of key factors on critical outcomes.
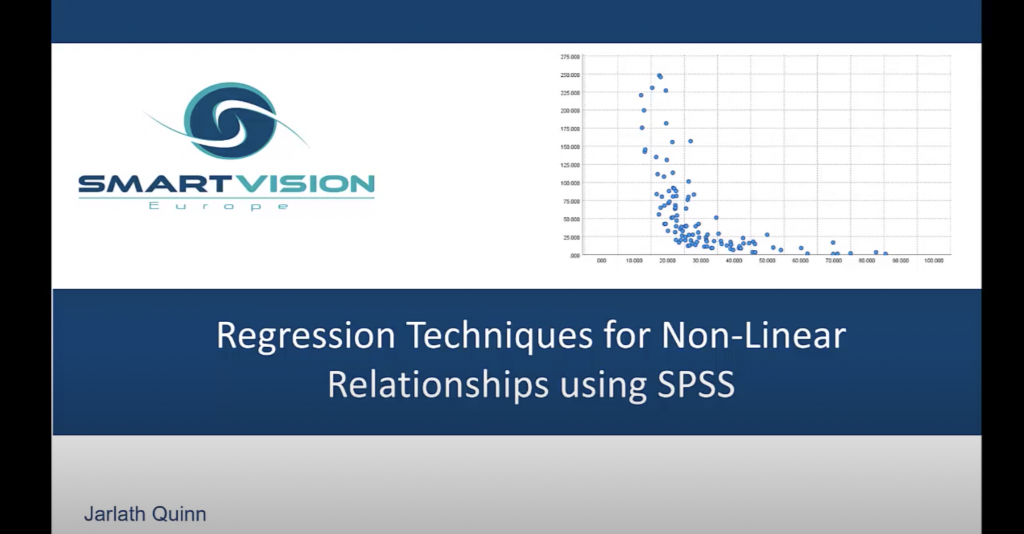
In this video Jarlath Quinn shows how you can move beyond simple linear regression to model curvilinear relationships using techniques such as variable transformations and quadratic regression before finally exploring how log-log regression can be used to model price elasticity of demand.
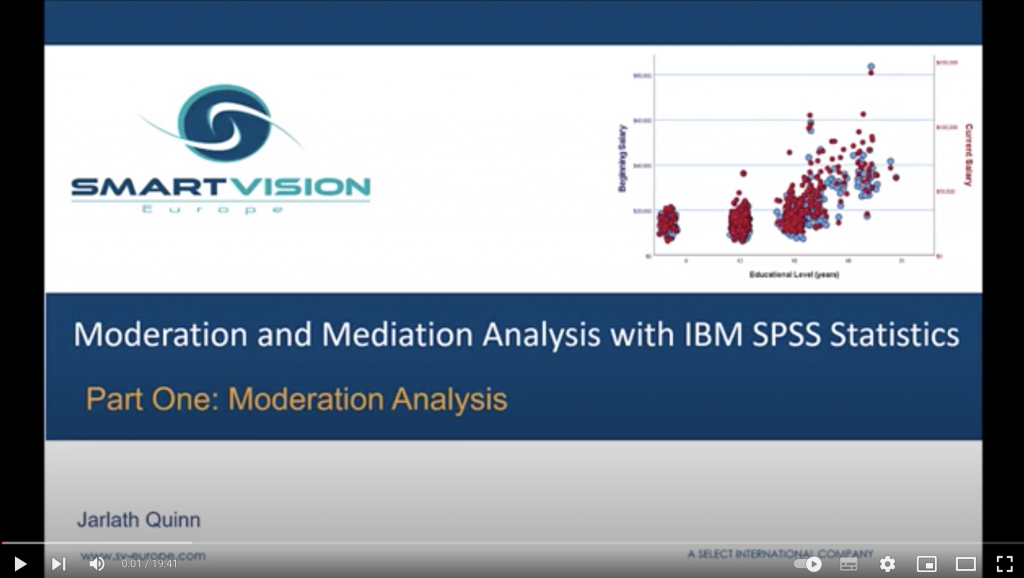
The video explores moderation analysis, which enables analysts to identify interaction effects that alter the relationship between a dependent and independent variable.
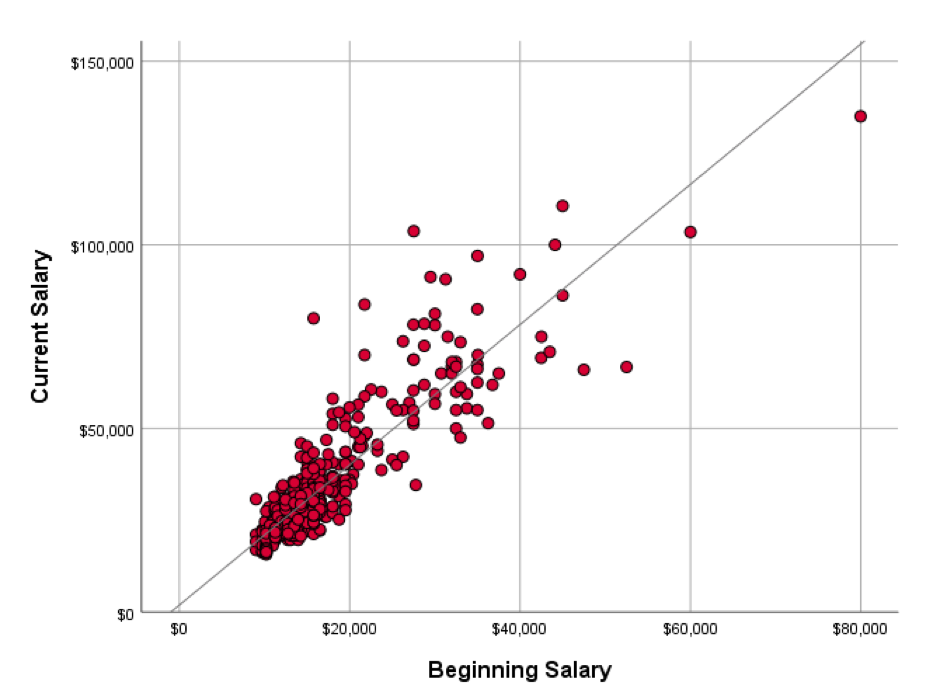
This video explores mediation analysis – an analytical approach used to test if a third factor could represent the underlying cause of a relationship between an independent and dependent variable.

In this webinar Jarlath Quinn shows how DataRobot empowers organisations to go beyond simplistic approaches and apply advanced, AI-driven forecasting models to hard problems using Automated Time Series.
This webinar focuses on the application and value of regression techniques in the IBM SPSS Statistics products. The session will give you a straightforward overview of how simple regression techniques can help your business and how to get started with regression analysis in SPSS.

This free educational webinar focuses on the value of predictive and advanced analytics in database marketing. You will learn how you can apply predictive analytics to both your outbound and inbound marketing campaigns in order to reduce your costs and increase your response and conversion rates.
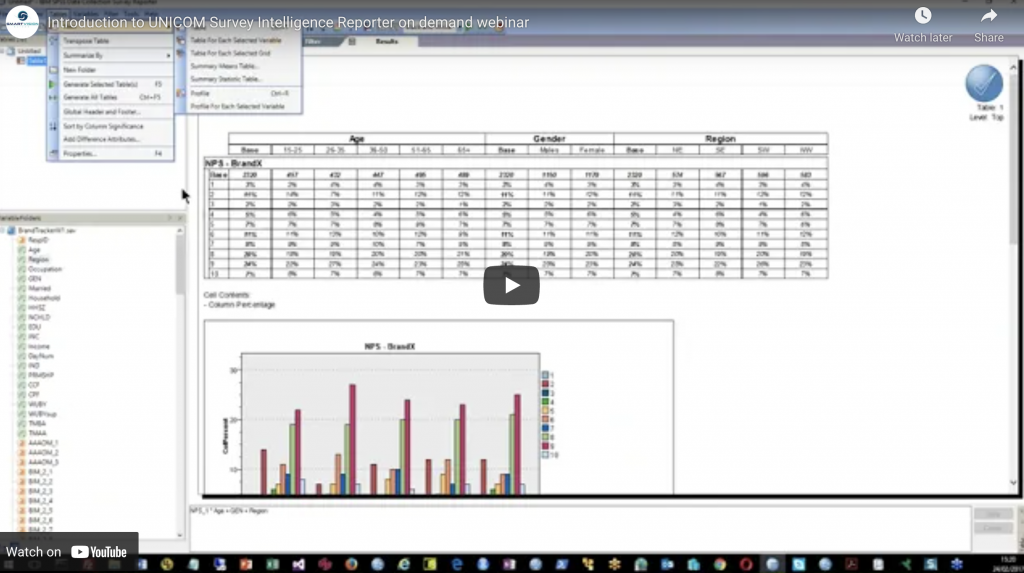
This event focused on the application and value of using UNICOM Intelligence Reporter (formerly IBM SPSS Survey Reporter), giving a straightforward overview of how UNICOM Intelligence Reporter can be used to speed up the production of flexible tables as part of any research or analytical project.
In this free educational webinar Jarlath Quinn shows how clean and prepare data for analysis using standard functionality in SPSS Statistics.

Smart Vision Europe recently announced an exciting new partnership with DataRobot, a rapidly rising player in the data science market with ambitions to be the de-facto leader of cloud-based AI for all. Over the past few months, I’ve been playing around with the platform, and I must say I am thoroughly impressed with what I …
Cloud AI at the cutting edge: taking DataRobot for a spin Read More »
This white paper provides an overview of significance testing – one of the most commonly used but also most frequently misunderstood terms in statistics and data analysis.
In this free on demand webinar we show how DataRobot’s AI Cloud platform creates actionable value from raw data in a single session.
At Smart Vision Europe we have many years of experience helping our customers successfully get started with applying and getting value from data science, AI and machine learning. We have set up and delivered numerous successful data science programmes across a range of industries as well as in the public sector. Under the collective banner …
Announcing Smart Vision’s new business partner relationship with Data Robot Read More »
What do so called ‘significance tests’ signify? Watch this on demand webinar to find out more.
IBM has just announced the general availability of IBM SPSS Statistics 28.0.1. This modification release introduces new statistical tests, enhancements to existing procedures and functional enhancements that will improve everyday usability. In this blog post we outline some of the new features and functionality. New statistical procedures and algorithm enhancements Kernel Ridge Regression As part …
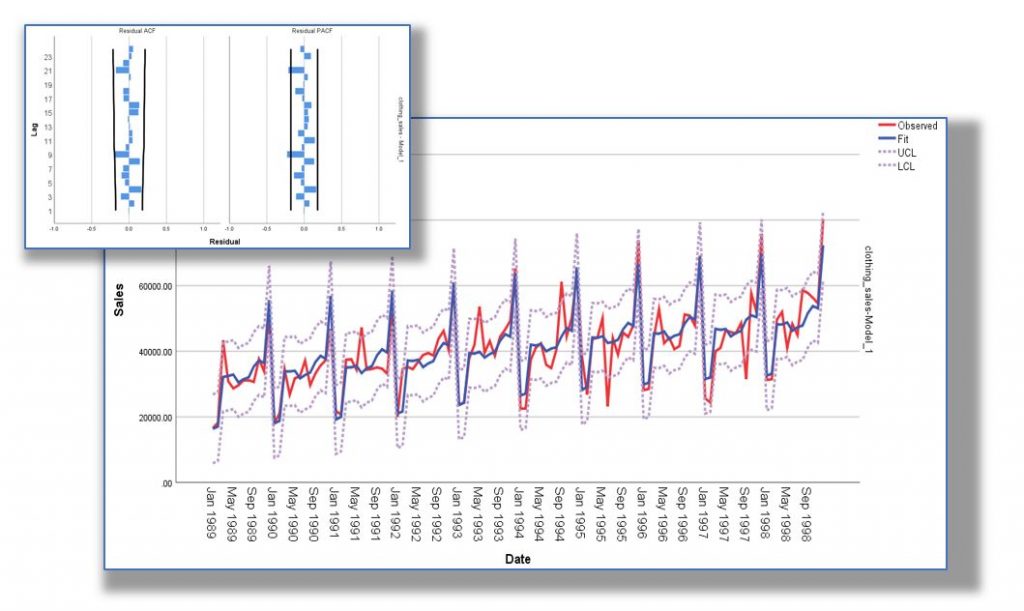
Forecasting with time series analysis has been used in both the public and commercial sectors for decades. Watch this webinar to see how it could work for your organisation.
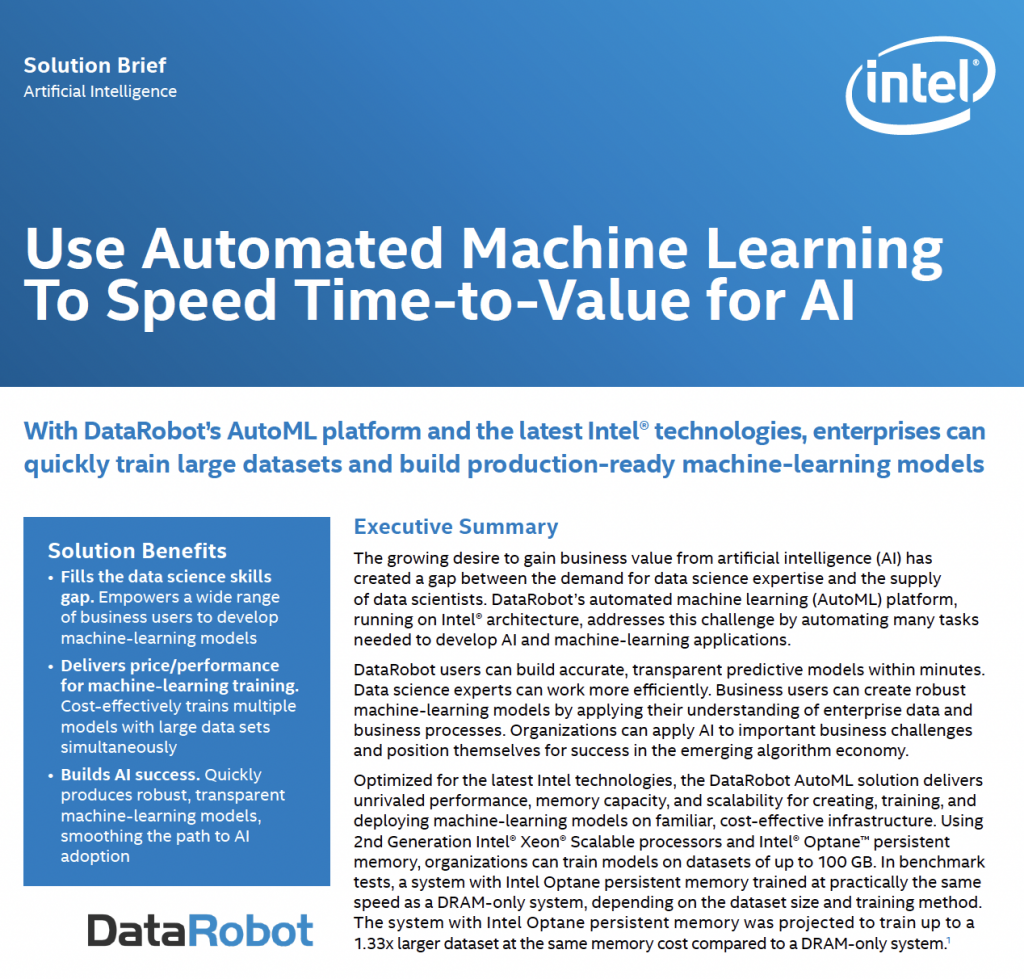
Download this ebook to learn how DataRobot and Intel® work together so that enterprises can quickly train large datasets and build production-ready machine learning models, and more.
Our report, The Business Value of MLOps by Thomas Davenport, highlights some of the most impactful benefits of MLOps tools and processes for different types of organisations. It is based on interviews with MLOps user companies and several MLOps experts.
In this ebook, you’ll see how business leaders are leveraging AI to decrease machine downtime, improve demand forecasts, and accelerate supply chain logistics. You’ll discover that AI isn’t an intimidating technology, but rather a practical tool to grow your business and change the world.
Our ebook, AI in Customer Analytics: Tapping Your Data for Success, takes a deep dive into the many ways that companies can put their AI to work for better customer success.
In our 10 Keys to AI Success in 2021 ebook, we show how organisations are overcoming hurdles and realising the enormous rewards that AI can bring to any organisation.
Download your free copy of our Customer Analytics for Dummies eBook. It will help you with understanding customer analytics, acquiring and segmenting valuable customers, recognising customer lifetime value, enhancing customer loyalty and retention, extracting value out of social media.
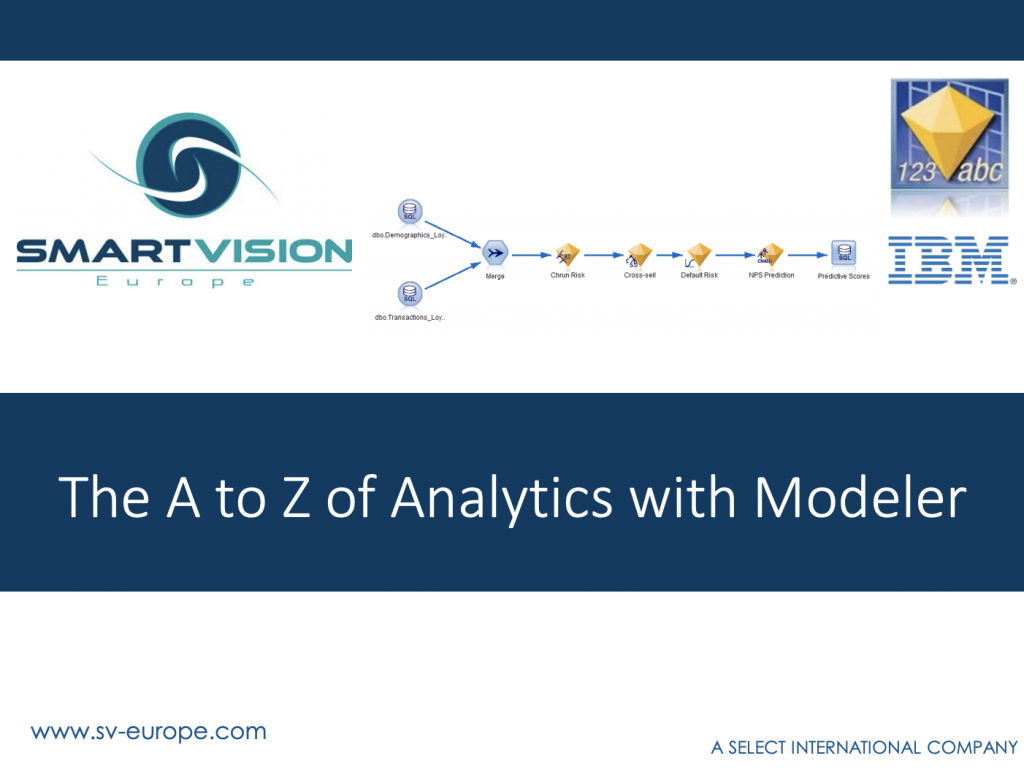
IBM SPSS is one of the most versatile analytics tools available on the market today. In this A-Z guide we outline just some of the many features that make it great.
In this book, you will discover types of machine learning techniques, models, and algorithms that can help achieve results for your company. This information helps both business and technical leaders learn how to apply machine learning to anticipate and predict the future.
Predictive analytics projects fail all the time. In this book, Jarlath Quinn draws on his experiences and those of his colleagues to explore precisely what drives success or failure in predictive analytics projects. When it works, why does it work and what can be done to manage the risk of failure?
If you’re familiar with programming languages such as Python or R then you can use them to extend the functionality of SPSS, automate more processes and make your jobs more stable and robust. This white paper tells you how to develop such IBM SPSS Statistics extension commands.
This free white paper presents some points you should consider if you use, or plan to use, a spreadsheet to perform statistical analysis. It also describes an alternative that in many cases will be more suitable.
This white paper discusses survey research by breaking it up into a seven step process — and clearly detailing how you maximize your efforts every step of the way. At each stage, it also shows how IBM SPSS predictive analytics technology can improve your results.
This paper considers the role service quality plays in predicting customer satisfaction and customer behavioral intentions in two types of service industries: lodging and retail banking.
This white paper presents a number of typical, real world examples of predictive analytics and shows how it can be used to address key business issues, with the aim of illustrating practical ways in which analytical capabilities can be deployed in a range of different organisations.
The purpose of this paper is to demonstrate the benefits of using R and SPSS together, rather than simply trying to go it alone with R. With SPSS software, R users get access to superior data management, a point-and-click interface, presentation-quality output and improved scalability.
Predictive analytics uses advanced algorithms to analyze donor data and deliver a 360-degree view of individual donors. Read this white paper to learn how to gain insight into the needs, preferences and behaviors of donors.
This white paper is designed to explain predictive analytics, followed by a look at how it can impact activity at the highest levels of institutional management. We provide examples of how predictive analytics has been used at a variety of institutions, including a review of its potential pitfalls and benefits.
This white paper provides an overview of geospatial analytics and why it is important to organisations seeking deeper insights about their business, customers or constituents.
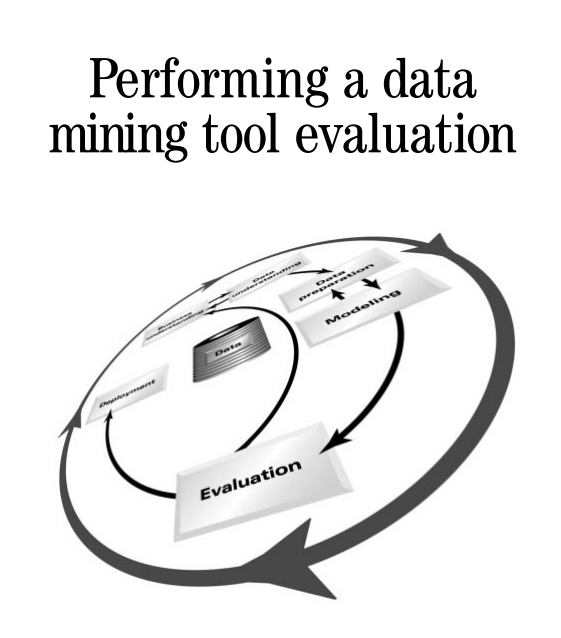
Using the CRISP-DM framework can help make this process much simpler and give you a clear structure and set of criteria that you can use for your assessment. We have prepared a short guide explaining how best to use CRISP DM as a framework for evaluating data mining tools.
This whitepaper explores the practical applications of predictive analytics within retail and how it can be used to deliver a smarter shopping experience.
This seminar provides an introduction to predictive analytics that’s specifically tailored to the needs of B2B organisations.

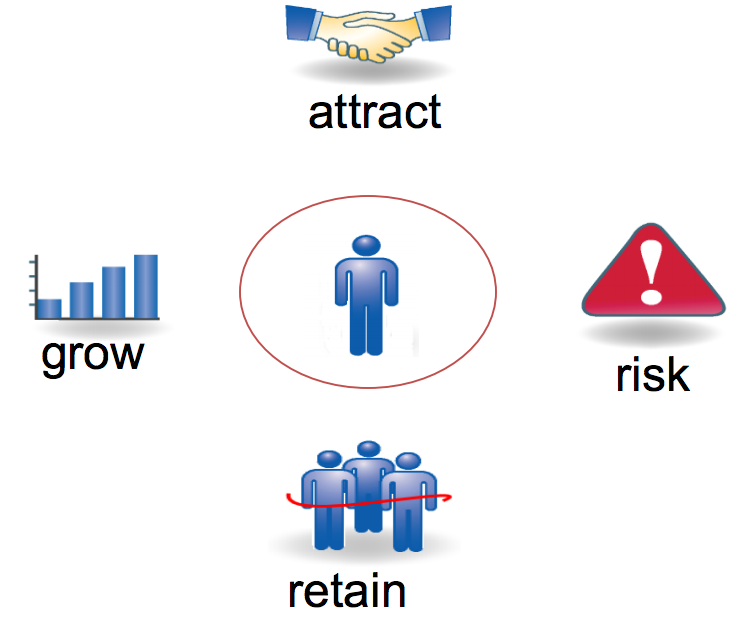
This webinar provides an overview of the different ways in which digital marketers can use SPSS Modeler to acquire new customers and to retain those that they already have. The webinar gives an introduction to core analytics applications and the benefits of using SPSS Modeler.

IBM SPSS Statistics is an incredibly powerful analytical tool. This event provides an overview of the range of modules available in SPSS and what each one does in order to help those relatively new to SPSS to understand its potential and identify new ways in which they could be using it.
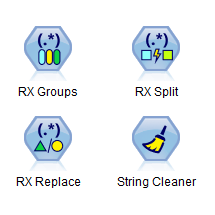
The new RX nodes in IBM SPSS Modeler extend the Visual Data Science approach of SPSS Modeler itself to Regular Expression handling.
In this webinar we demonstrate how you can use the power of REGEX to perform the most typical text handling tasks, without the pain of learning yet another programming language.